. 2002 Feb;109(3):317-25.
doi: 10.1172/JCI13870.

Effects of reduced mucus oxygen concentration in airway Pseudomonas infections of cystic fibrosis patients

Affiliations

Effects of reduced mucus oxygen concentration in airway Pseudomonas infections of cystic fibrosis patients

Dieter Worlitzsch et al. J Clin Invest. 2002 Feb.

Abstract

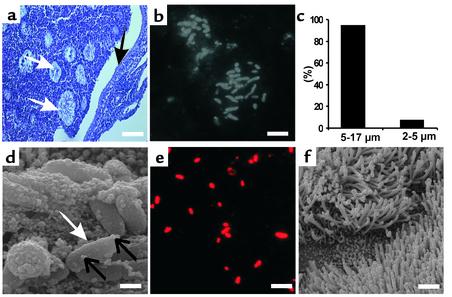
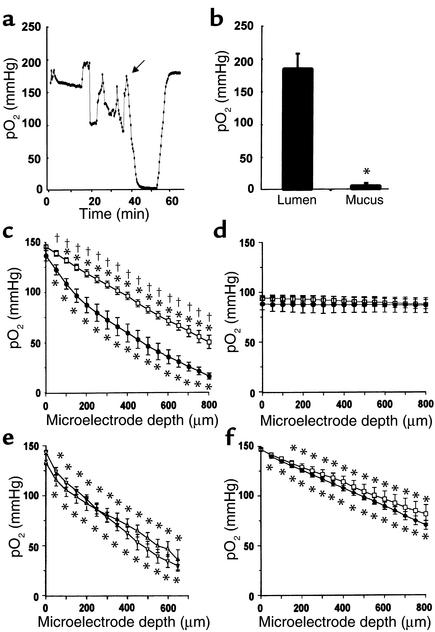
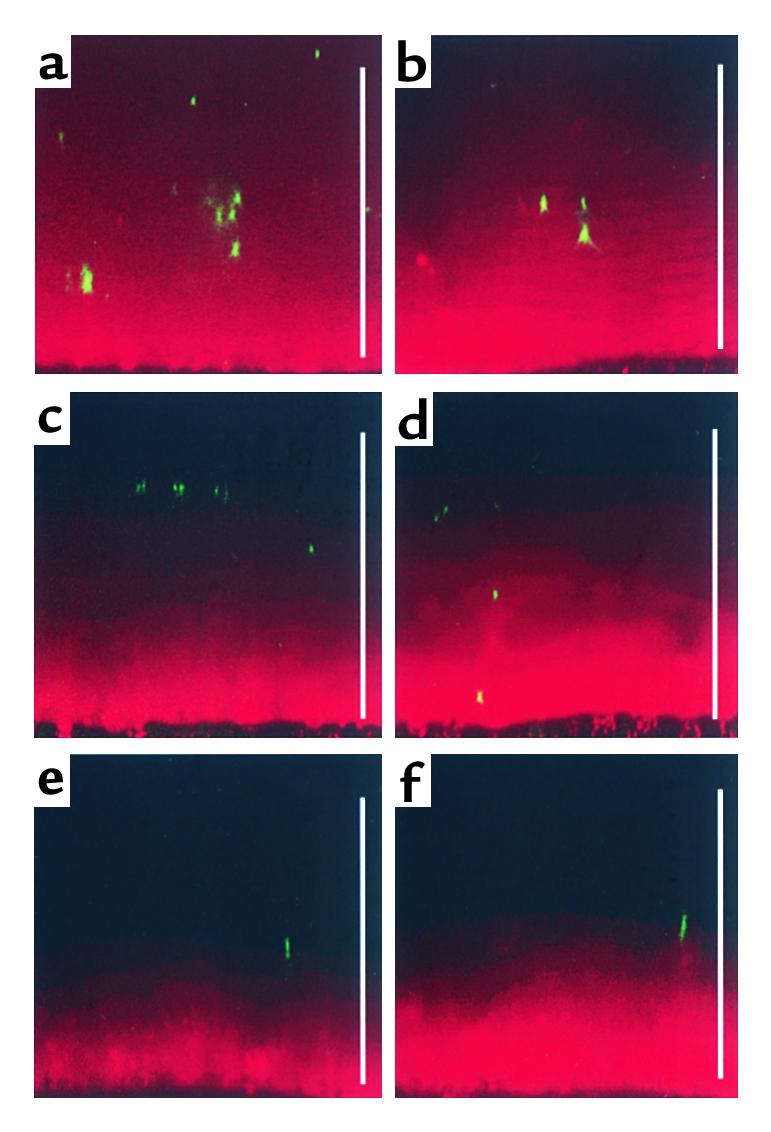
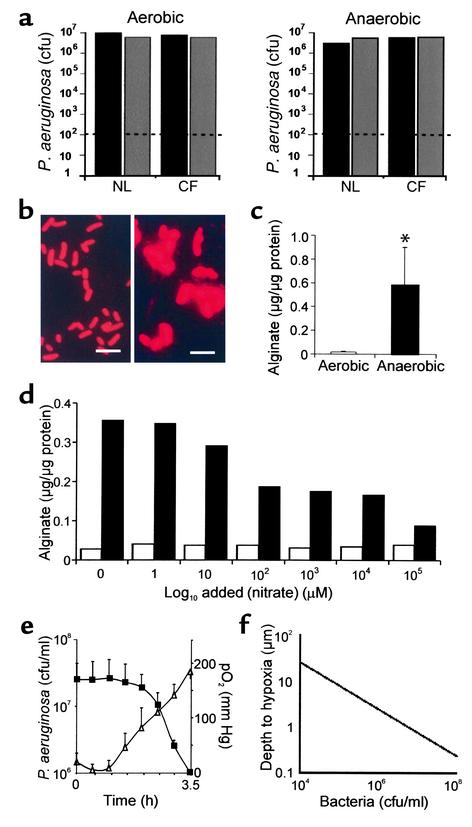
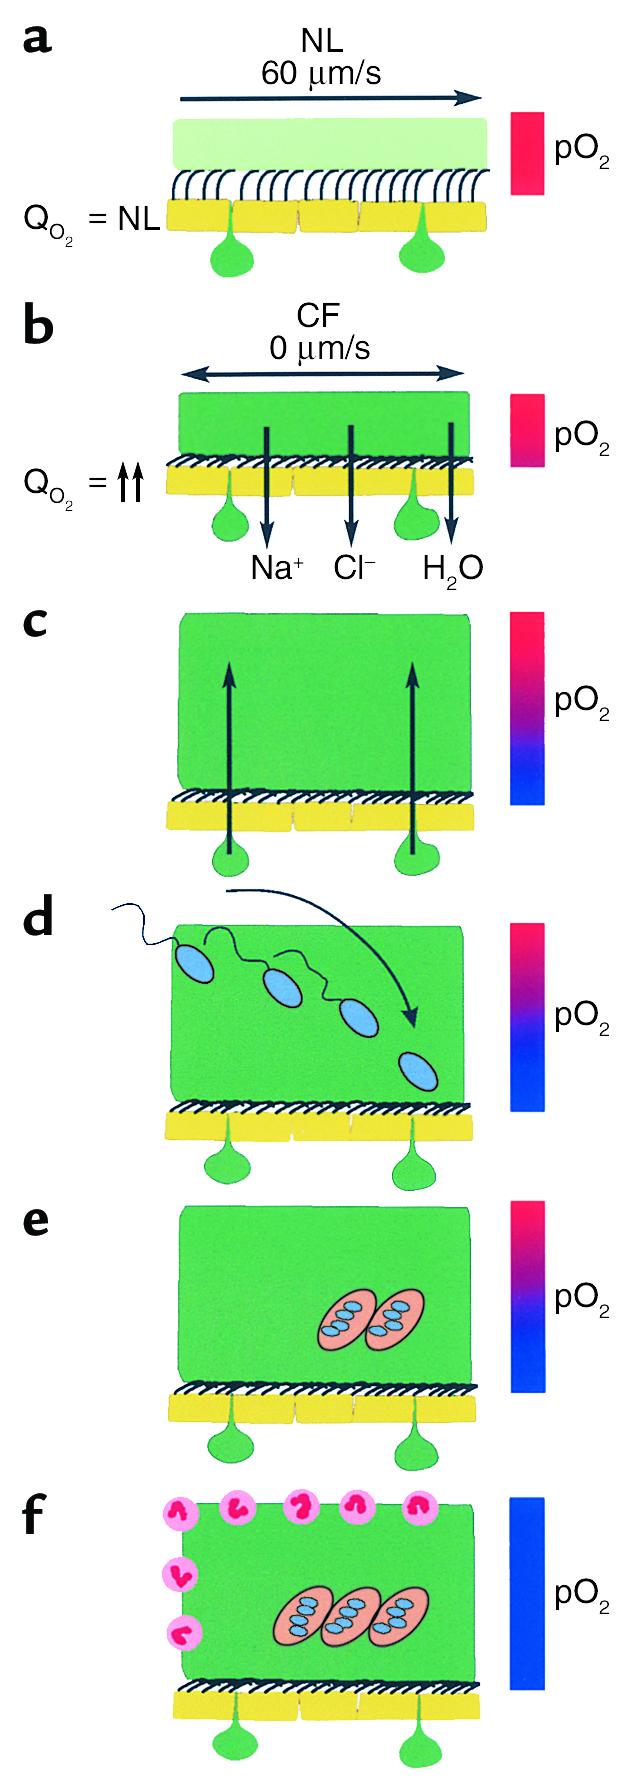
Current theories of CF pathogenesis predict different predisposing "local environmental" conditions and sites of bacterial infection within CF airways. Here we show that, in CF patients with established lung disease, Pseudomonas aeruginosa was located within hypoxic mucopurulent masses in airway lumens. In vitro studies revealed that CF-specific increases in epithelial O(2) consumption, linked to increased airway surface liquid (ASL) volume absorption and mucus stasis, generated steep hypoxic gradients within thickened mucus on CF epithelial surfaces prior to infection. Motile P. aeruginosa deposited on CF airway surfaces penetrated into hypoxic mucus zones and responded to this environment with increased alginate production. With P. aeruginosa growth in oxygen restricted environments, local hypoxia was exacerbated and frank anaerobiosis, as detected in vivo, resulted. These studies indicate that novel therapies for CF include removal of hypoxic mucus plaques and antibiotics effective against P. aeruginosa adapted to anaerobic environments.


Figures

Figure 1
Figure 1
P. aeruginosa is localized in intraluminal material of freshly excised CF airways and binds to mucus. (a) Thin section of an obstructed CF bronchus, stained with hematoxalin/eosin. Note the absence of P. aeruginosa on epithelial surface (black arrow) and presence of P. aeruginosa macrocolonies within intraluminal material (white arrows). Blue gap is an artifact due to fixation. (b) P. aeruginosa within macrocolonies in a lung section, stained with rabbit Ab’s against P. aeruginosa. Bars: a, 100 μm; b, 10 μm. (c) Percentage of bacteria detected at a distance of 2-5 μm or 5-17 μm from the epithelial surface of lungs from nine CF patients. Shrinkage artifacts were subtracted from calculated distances. (d) Scanning electron micrograph of mucus-coated spheroid derived from CF respiratory epithelium. P. aeruginosa (white arrow) were enmeshed in mucus (black arrows) following a 2-hour incubation. (e) Immunofluorescent staining of mucins (anti-mucin Ab) bound to P. aeruginosa strain PAO1 in vitro. (f) Spheroid with adherent mucus removed by prewash, then incubated with P. aeruginosa for 2 hours. Note the absence of bacteria on ciliated epithelial cell surfaces. Bars: d, 0.6 μm; e, 4 μm; f, 2.5 μm. Quantitative comparisons of PAO1 binding revealed higher binding to mucus-coated NESfrom normal subjects (21.3 ± 10.6 bacteria/NES) versus non-mucus-coated (washed) NES (7.1 ± 0.1 bacteria/NES) (n = 6; 3 normal subjects; P < 0.05). Importantly, these values were not different for CF NESs (26.4 ± 4.1 bacteria/NES for mucus-coated NESs; 7.7 ± 3.9 bacteria/NES for washed NESs).
Figure 2
Figure 2
Oxygen partial pressure (pO2) CF airways in vivo and in thick films of ASL on human airway epithelial cultures. (a) pO2 in CF airways. First 30 minutes represents measurement in a nonobstructed region of the airway lumen. The arrow indicates insertion of oxygen probe into a mucopurulent mass. The pO2 returned to basal values after probe retraction from the adherent mass into the nonobstructed airway region. (b) pO2 in nonobstructed CF airway lumens (L) and CF mucopurulent masses (M) in vivo. n = 3 CF subjects; *P = 0.001. (c) Plots of pO2 gradients under thick film conditions at 37°C in NL (squares; eight cultures/five subjects) and CF cultures (circles; six cultures/four subjects). (d) pO2 gradients under thick film conditions measured at 4°C in NL (squares; five cultures/three subjects) and CF cultures (circles; five cultures/three subjects). (e) pO2 gradients in CF mucus that had accumulated for 48 hours on CF culture surfaces and had become stationary due to volume hyperabsorption (inverted triangles). Mucus transport was restored in these cultures by addition of 30 μl PBS, and pO2 gradients remeasured 1–2 hours later (triangles; six cultures; three subjects each). (f) Comparison of pO2 gradients in NL (squares; nine cultures/six subjects) and PCD (diamonds; five cultures/two subjects) cultures under thick film conditions. Data are shown as mean ± SEM. *Significantly different (P < 0.05) from pO2 at the air-liquid interface (0 μm). Significant difference (P < 0.05) between NL and CF.
Figure 3
Figure 3
Localization of P. aeruginosa and beads in transported and stationary ASL (mucus) produced by planar CF cultures. Representative confocal images of ASL (red) fluorescent P. aeruginosa (green) or green fluorescent beads. P. aeruginosa or beads were added to the air-liquid interface in 25-nl aliquots by a microsyringe mounted in a hydraulic micromanipulator. (a) X-Z confocal image of P. aeruginosa 3 minutes after addition to the surface of ASL (mucus) exhibiting rotational transport. (b) X-Z confocal image of beads 3 minutes after addition to the surface of mucus exhibiting rotational transport. Note that due to the rapid “tumbling” movement of the mucus it was not possible to obtain early time-point images of P. aeruginosa or beads at the air-liquid interface. P. aeruginosa 3 minutes (c) and 15 minutes (d) after addition to stationary mucus. Beads at 3 minutes (e) and 15 minutes later (f) after addition to stationary mucus. Scale bars, 100 μm.
Figure 4
Figure 4
Growth and alginate production of P. aeruginosa under aerobic versus anaerobic conditions. (a) Growth of P. aeruginosa in NL or CF ASL under aerobic or anaerobic conditions. Two strains, PAO1 (black bars) and ATCC 700829 (gray bars), were inoculated (∼100–200 bacteria, dashed line) in 30 μl NL or CF ASL and number of bacteria quantitated 72 hours later. The results presented are from a single representative experiment of three performed. The differences in the CFU/ml in the three experiments were less than 0.3 log 10. (b) Immunofluorescence detection of alginate production by PAO1 after aerobic (8 hours; left) or anaerobic (12 hours; right) conditions (magnification, ×1,000; bars, 10 μm). (c) Alginate production of PAO1 by the carbazole assay after growth under anaerobic (black bar) or aerobic (white bar) conditions for 4 days without added nitrate. *P < 0.05. (d) Alginate production per microgram bacterial protein mass of PAO1 as a function of the added NO3 to PIA under aerobic (white bars) and anaerobic (black bars) conditions. (e) pO2 (filled squares) in an aerobically growing suspension of P. aeruginosa (open triangles) as a function of time (hours). (f) Mathematical analysis of depths from air-mucus interface at which pO2 becomes zero for simulated mucus masses/plaques containing different concentrations of P. aeruginosa bacteria (colony-forming units per milliliter).
Figure 5
Figure 5
Schematic model of the pathogenic events hypothesized to lead to chronic P. aeruginosa infection in airways of CF patients. (a) On normal airway epithelia, a thin mucus layer (light green) resides atop the PCL (clear). The presence of the low-viscosity PCL facilitates efficient mucociliary clearance (denoted by vector). A normal rate of epithelial O2 consumption (QO2; left) produces no O2 gradients within this thin ASL (denoted by red bar). (bf) CF airway epithelia. (b) Excessive CF volume depletion (denoted by vertical arrows) removes the PCL, mucus becomes adherent to epithelial surfaces, and mucus transport slows/stops (bidirectional vector). The raised O2 consumption (left) associated with accelerated CF ion transport does not generate gradients in thin films of ASL. (c) Persistent mucus hypersecretion (denoted as mucus secretory gland/goblet cell units; dark green) with time increases the height of luminal mucus masses/plugs. The raised CF epithelial QO2 generates steep hypoxic gradients (blue color in bar) in thickened mucus masses. (d) P. aeruginosa bacteria deposited on mucus surfaces penetrate actively and/or passively (due to mucus turbulence) into hypoxic zones within the mucus masses. (e) P. aeruginosa adapts to hypoxic niches within mucus masses with increased alginate formation and the creation of macrocolonies. (f) Macrocolonies resist secondary defenses, including neutrophils, setting the stage for chronic infection. The presence of increased macrocolony density and, to a lesser extent neutrophils, render the now mucopurulent mass hypoxic (blue bar).

References

    1. Davis PB, Drumm M, Konstan MW. Cystic fibrosis. Am J Respir Crit Care Med. 1996;154:1229–1256. - PubMed
    1. Meyer KC, Zimmerman J. Neutrophil mediators, Pseudomonas, and pulmonary dysfunction in cystic fibrosis. J Lab Clin Med. 1993;121:654–661. - PubMed
    1. Doering, G., Knight, R., and Bellon, G. 2000. Immunology of cystic fibrosis. In Cystic fibrosis. M.E. Hodson and D.M. Geddes, editors. Arnold Publishers. London, United Kingdom. 109–140.
    1. Saiman L, Prince A. Pseudomonas aeruginosapili bind to asialoGM1 which is increased on the surface of cystic fibrosis epithelial cells. J Clin Invest. 1993;92:1875–1880. - PMC - PubMed
    1. de Bentzmann S, Plotkowski C, Puchelle E. Receptors in the Pseudomonas aeruginosaadherence to injured and repairing airway epithelium. Am J Respir Crit Care Med. 1996;154:S155–S162. - PubMed

Publication types

MeSH terms