. 2002 Feb 4;195(3):317-26.
doi: 10.1084/jem.20011558.

Differential T cell function and fate in lymph node and nonlymphoid tissues

Affiliations

Differential T cell function and fate in lymph node and nonlymphoid tissues

Nicola L Harris et al. J Exp Med. .

Abstract

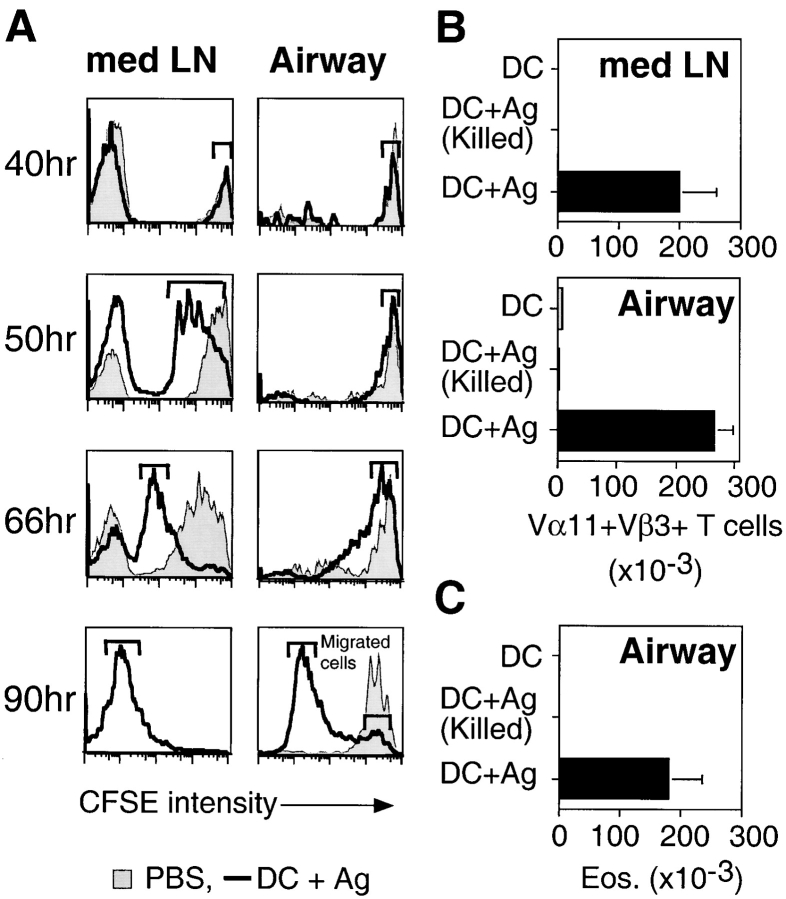
The functions and fate of antigen-experienced T cells isolated from lymph node or nonlymphoid tissues were analyzed in a system involving adoptive transfer of in vitro-activated T cells into mice. Activated T cells present in the lymph nodes could be stimulated by antigen to divide, produce effector cytokines, and migrate to peripheral tissues. By contrast, activated T cells that had migrated into nonlymphoid tissues (lung and airway) produced substantial effector cytokines upon antigen challenge, but were completely unable to divide or migrate back to the lymph nodes. Therefore, activated T cells can undergo clonal expansion in the lymph node, but are recruited and retained as nondividing cells in nonlymphoid tissues. These distinct regulatory events in lymph node and nonlymphoid tissues reveal simple key mechanisms for both inducing and limiting T cell immunity.


Figures

Figure 1.
Figure 1.
Activation marker expression by pre- and postadoptively transferred Vα11+Vβ3+ T cells. (A) Activated T cells were generated in vitro, and then examined for expression of CD44, 3G-11 and CD62L. Profiles shown are for live Vα11+Vβ3+ T cells. Activation marker expression on naive peripheral blood Vα11+Vβ3+ T cells from 5C.C7 mice is shown as a control. (B) In vitro–activated T cells were CFSE labeled, and 2 × 10⁷ CFSE+Vα11+Vβ3+ T cells injected into the tail vein of naive syngenic B10.A hosts. 2–5 d later, lymphocytes were purified from the peripheral lymph nodes, lung, and airway, and their expression of CD44, 3G-11, and CD62L examined. Profiles shown are for live CFSE+ Vα11+Vβ3+ T cells. Numbers reflect the percentage of cells that fall within the shown boundaries. The data shown are from one representative experiment using six to eight mice per group. Similar results were obtained from three separate experiments.
Figure 2.
Figure 2.
In vivo accumulation and division of activated Vα11+Vβ3+ T cells in the med LN and airway of mice challenged intranasally with MCC88–103. Activated Vα11+Vβ3+ T cells were generated in vitro, CFSE labeled, and 5 × 10⁶ CFSE+Vα11+Vβ3+ T cells injected into the tail vein of naive syngenic B10.A hosts. On that day mice were challenged intranasally with PBS or MCC88–103. Responses were measured at indicated time points after intranasal challenge. (A) Cell division was examined by FACS® analysis of CFSE intensity. Profiles shown are for live Vα11+Vβ3+ T cells. (B) Accumulation of live Vα11+Vβ3+ T cells in the med LN and airway of intranasally challenged mice was examined by FACS®. (C) Eosinophil infiltration into the airway of intranasally challenged mice was examined by BAL and differential cell counting of Giemsa-stained cytospins. The data shown represents mean ± SE of two to three mice per group from one representative experiment. Similar results were obtained from three separate experiments.
Figure 3.
Figure 3.
In vivo cytokine production by activated Vα11+Vβ3+ T cells in the med LN or lung and airway, after intranasal challenge with MCC88–103. Activated Vα11+Vβ3+ T cells were generated in vitro, CFSE labeled, and 7.5 × 10⁶ CFSE+Vα11+Vβ3+ T cells injected into the tail vein of naive syngenic B10.A hosts. The next day mice were challenged intranasally with MCC88–103 or PBS. 2 h later mice were killed and lymphocytes from the med LN, or lung and airway, were incubated for 20 min in cIMDM containing 2 μM monensin. T cells were then fixed and examined for expression of IL-4, IL-2, or IFN-γ using intracellular cytokine staining. Profiles shown are for CFSE+ T cells. The data shown represents mean ± SE of three mice per group from one representative experiment. Similar results were obtained from three separate experiments.
Figure 4.
Figure 4.
In vitro division and cytokine production by activated Vα11+Vβ3+ T cells reisolated from the lymph nodes, or lung and airway. Activated Vα11+Vβ3+ T cells were generated in vitro, CFSE labeled, and 2 × 10⁷ CFSE+Vα11+Vβ3+ T cells injected into the tail vein of naive syngenic B10.A hosts. 2–5 d later lymphocytes were purified from the peripheral lymph nodes, and lung and airway. (A) 5 × 10⁵ lymph node, or lung and airway, cells were cultured with 1.5 × 10⁶ T cell–depleted splenocytes from naive B10.A mice ± 10 μg/ml MCC88–103. After 48 h of culture, T cell division was examined by FACS® analysis of CFSE intensity. Profiles shown are for live Vα11+Vβ3+ T cells. (B) Peripheral lymph node, or lung and airway, T cells were restimulated with anti-CD3 and anti-CD28 in the presence of 2 μM monensin for 6 h. T cells were then examined for expression of IL-4, IL-5, IL-2, or IFN-γ using intracellular cytokine staining. Profiles shown are for CFSE+Vα11+Vβ3+ T cells. In both A and B, lung represents lung and airway cells. The data shown are from representative experiments, using six to eight mice per group. Each experiment was repeated two to three times with similar results.
Figure 5.
Figure 5.
Effect of intranasal challenge with BMDC + MCC88–103 on division of adoptively transferred Vα11+Vβ3+ T cells. Activated Vα11+Vβ3+ T cells were generated in vitro, CFSE labeled, and 5 × 10⁶ CFSE+Vα11+Vβ3+ T cells injected into the tail vein of naive syngenic B10.A hosts. On that day mice were challenged intranasally with 106 ethanol-killed or live BMDC ± MCC88–103. Responses were measured at indicated time points after intranasal challenge. (A) The extent of cell division was examined by FACS® analysis of CFSE intensity. Profiles shown are for live Vα11+Vβ3+ T cells (B) Accumulation of live Vα11+Vβ3+ T cells in the med LN or airway of intranasally challenged mice was examined by FACS®. (C) Eosinophil infiltration into the airway of intranasally challenged mice was enumerated by BAL and differential cell counting of Giemsa-stained cytospins. The data shown represent mean ± SE of three to four mice per group from one representative experiment. Similar results were obtained in two to four separate experiments.
Figure 6.
Figure 6.
In vivo division of intranasally administered, activated Vα11+Vβ31 T cells, after intranasal challenge with MCC88–103 ± IL-2. Activated Vα11+Vβ3+ T cells were generated in vitro, CFSE labeled, and 106 CFSE+Vα11+Vβ3+ T cells administered intranasally to naive syngenic B10.A hosts. On that day mice were challenged intranasally with PBS or MCC88–103. At days 0 and 2 after challenge, mice were additionally treated with an intranasal inoculation of 500 U rhIL-2 in cIMDM, or cIMDM alone. (A) On day 4 after MCC88–103 intranasal challenge, cell division was examined by FACS® analysis of CFSE intensity. Profiles shown are for live Vα11+Vβ3+ T cells. (B) Accumulation of eosinophils in the airway 4 d after MCC88–103 intranasal challenge was determined by BAL and differential cell counting of Giemsa-stained cytospins. The data shown represents the mean ± SE of three to four mice from one representative experiment. Similar results were obtained from two to four separate experiments.
Figure 7.
Figure 7.
Migration of intranasally administered, activated Vα11+ Vβ3+ T cells. Activated Vα11+Vβ3+ T cells were generated in vitro, CFSE labeled, and 106 CFSE+Vα11+Vβ3+ T cells administered intranasally to naive syngenic B10.A hosts. (A) 4 d later lymphocytes were isolated from the airway, lung, med LN, mes LN, liver, and spleen. (B) Alternatively, recipient mice were immunized intraperitoneally with 100 μg MCC88–103 in 200 μl alum adjuvant, and lymphocytes isolated from the airway, spleen, and peritoneal cavity at days two and four after immunization. Profiles shown are for live Vα11+Vβ3+ T cells. The data shown are from representative experiments, using three mice per group. Each experiment was repeated two to four times with similar results.

References

    1. Gowans, J.L., and E.J. Knight. 1964. The route of recirculation of lymphocytes in the rat. Proc. R. Soc. Lond. B. 159:257–282. - PubMed
    1. Picker, L.J., and E.C. Butcher. 1992. Physiological and molecular mechanisms of lymphocyte homing. Annu. Rev. Immunol. 10:561–581. - PubMed
    1. Mackay, C.R., W.L. Marston, and L. Dudler. 1990. Naive and memory T cells show distinct pathways of lymphocyte recirculation. J. Exp. Med. 171:801–817. - PMC - PubMed
    1. Koh, W.P., E. Chan, K. Scott, G. McCaughan, M. France, and B. Fazekas de St Groth. 1999. TCR-mediated involvement of CD4+ transgenic T cells in spontaneous inflammatory bowel disease in lymphopenic mice. J. Immunol. 162:7208–7216. - PubMed
    1. Seder, R.A., W.E. Paul, M.M. Davis, and B. Fazekas de St Groth. 1992. The presence of interleukin 4 during in vitro priming determines the lymphokine-producing potential of CD4+ T cells from T cell receptor transgenic mice. J. Exp. Med. 176:1091–1098. - PMC - PubMed

Publication types

MeSH terms

Substances