. 2002 Feb 4;195(3):335-41.
doi: 10.1084/jem.20010934.

Contact-dependent stimulation and inhibition of dendritic cells by natural killer cells

Affiliations

Contact-dependent stimulation and inhibition of dendritic cells by natural killer cells

Diego Piccioli et al. J Exp Med. .

Abstract

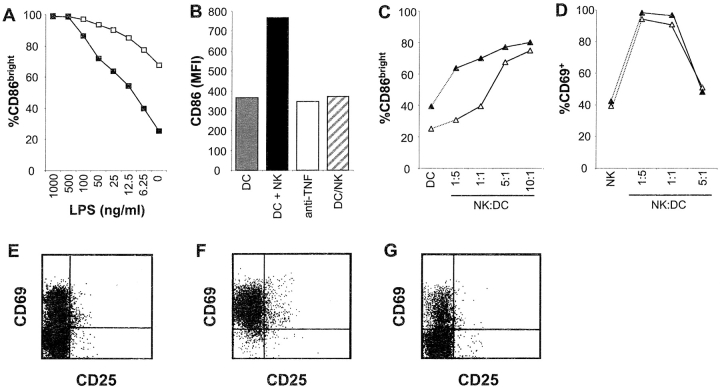
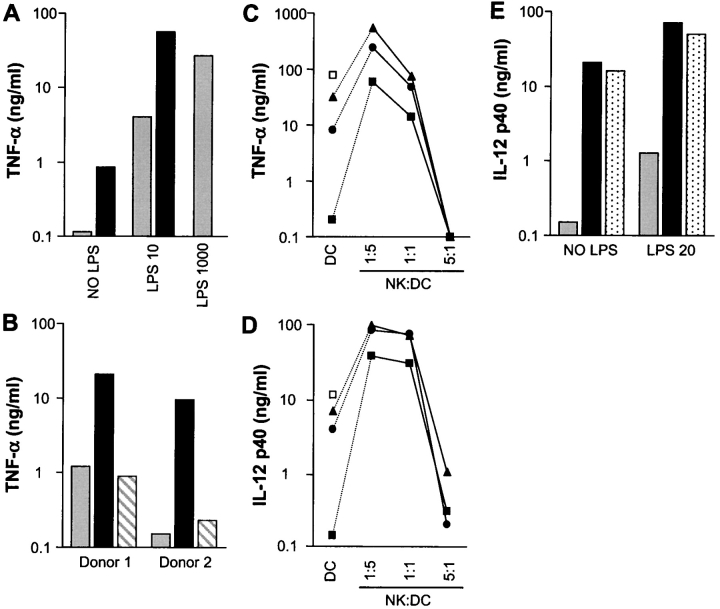
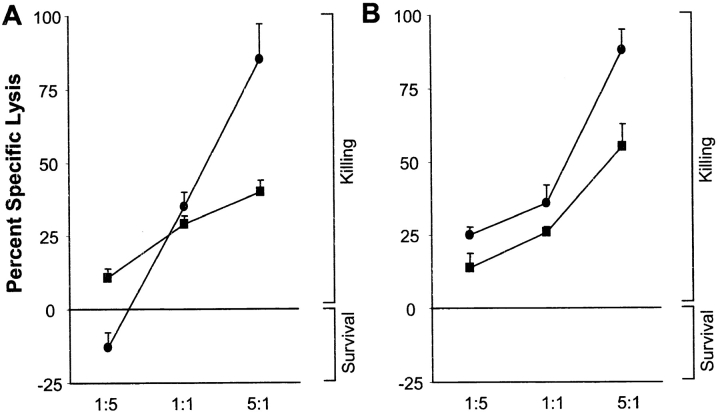
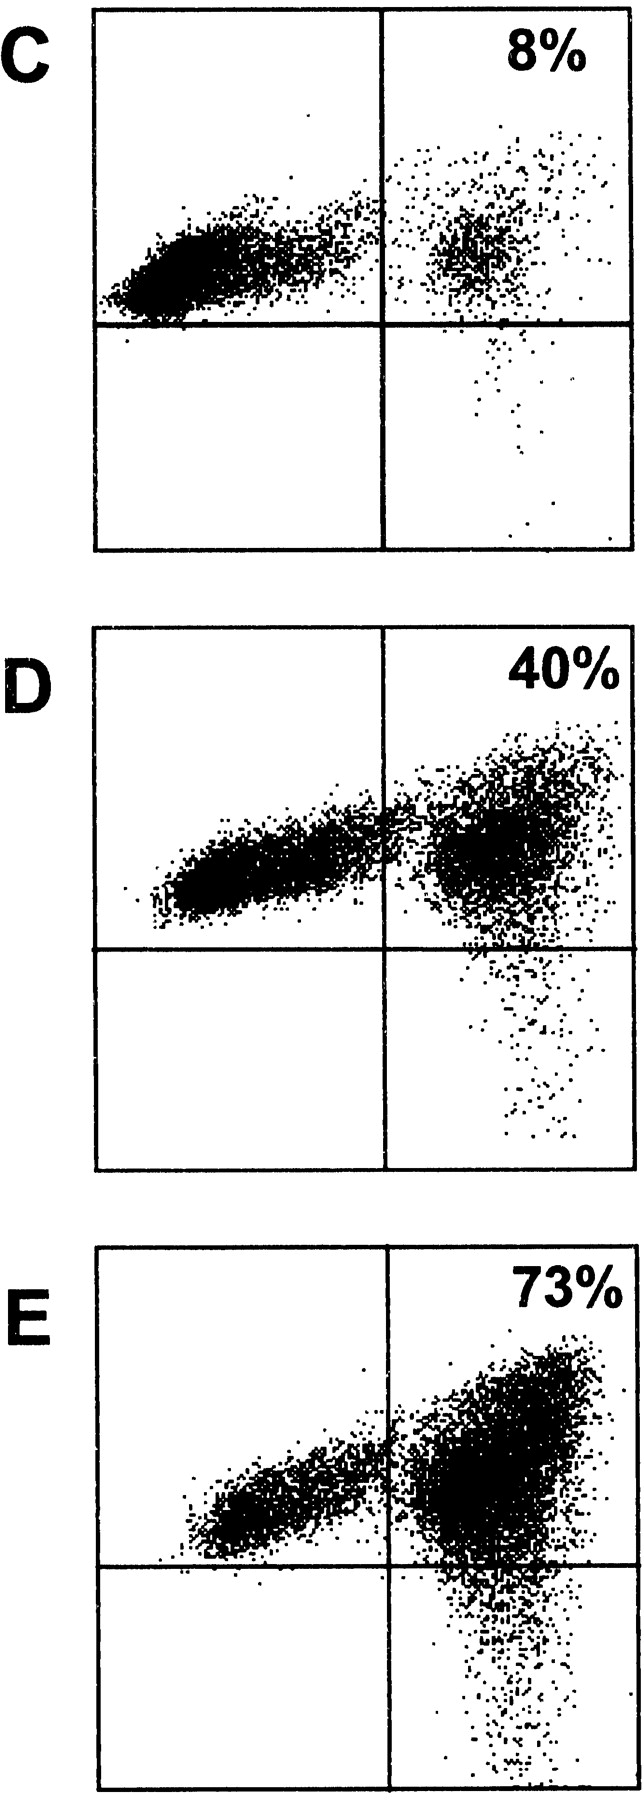
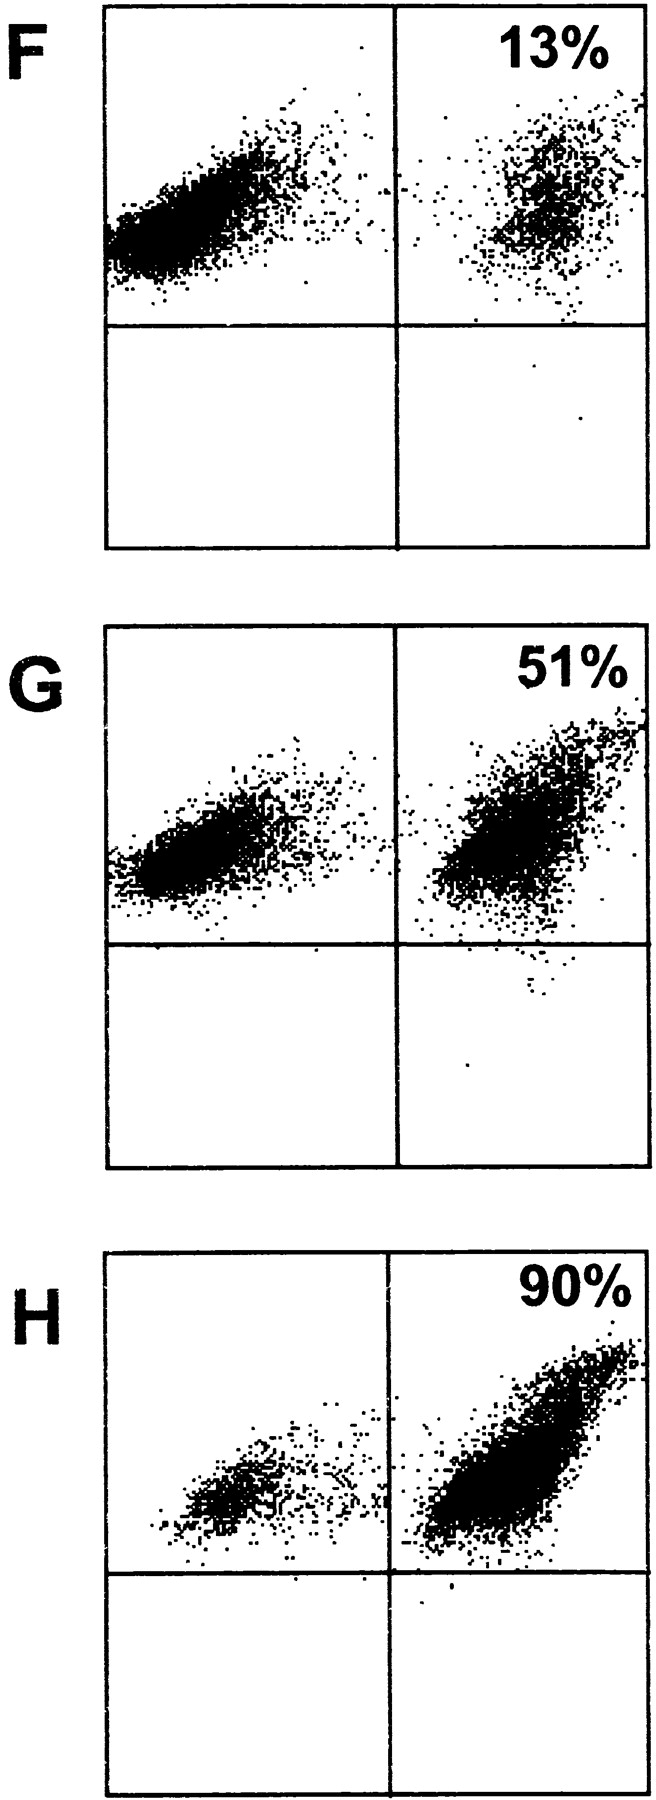
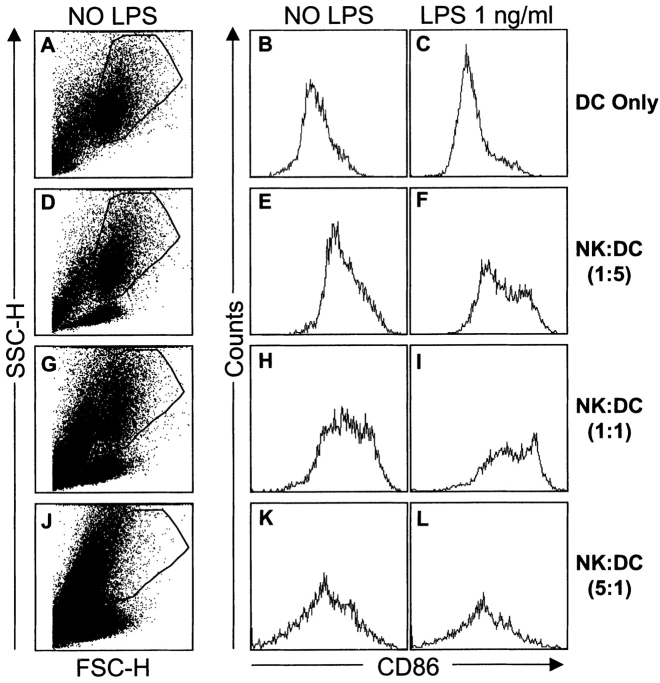
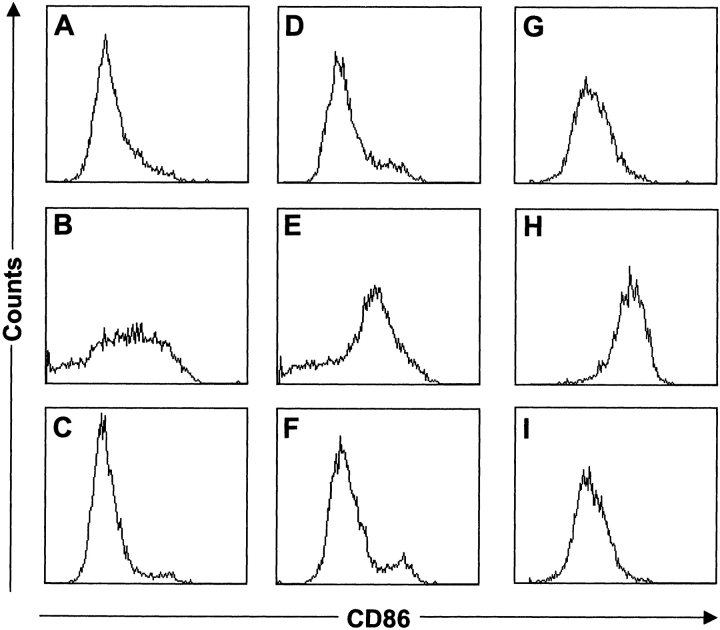
Natural killer (NK) cells and dendritic cells (DCs) are two distinct cell types of innate immunity. It is known that the in vitro interaction of human NK cells with autologous DCs results in DC lysis. Here we show that contact-dependent interactions between activated human NK cells and immature DCs (iDCs) provides a "control switch" for the immune system. At low NK/DC ratios, this interaction dramatically amplifies DC responses, whereas at high ratios it completely turns off their responses. Specifically, culture of activated human NK cells with iDCs, at low NK/DC ratios (1:5), led to exponential increases in DC cytokine production, which were completely dependent on cell-to-cell contact. DC maturation was also driven by cognate interactions with NK cells and maturation was dependent on endogenously produced TNF-alpha in the culture. At slightly higher NK/DC ratios (5:1), inhibition of DC functions was the dominant feature due to potent killing by the autologous NK cells. Resting NK cells also stimulated autologous DC maturation in a TNF-alpha/contact-dependent manner, however, increasing the NK/DC ratio only led to an enhancement of this effect.


Figures

Figure 1.
Figure 1.
Reciprocal stimulation of resting NK cells and autologous iDCs. Cultured iDCs and resting, purified NK cells were incubated alone or in combination for 18 h (E–G) or 48 h (A–D). After culture the cells were analyzed by flow cytometry for the expression of CD86 (DCs; A–C), CD69 (NK; D) or CD69 and CD25 (NK; E–G). Specific analysis of NK cell or DC subsets was achieved by a combination of gating on forward versus side scatter differences and staining with antibodies for CD56 (NK) or CD86 (DC). (A) iDCs were incubated alone (▪) or with NK cells (□) at a ratio of 5:1 (NK/DC) in the presence of the indicated doses of LPS. The percentage of CD86bright DC was determined by specific gating. (B) The representative experiment shown was performed in the presence of 6.25 ng/ml of LPS and the iDCs were incubated alone (gray bar); with NK cells at a 5:1 (NK/DC) ratio (black bar); with NK cells (5:1) plus 10 μg/ml of a neutralizing antibody for TNF-α (white bar); or with NK cells (5:1) but separated in trans-wells (striped bar). Changes in DC maturation were determined by measuring CD86 mean fluorescence intensity (MFI). (C) iDCs were incubated alone (DCs) or with NK cells at the indicated ratios (NK/DC) in the presence (▴) or absence (▵) of 6.25 ng/ml of LPS. DC maturation was determined as in A. (D) NK cells were incubated for 48 h either alone (NK) or with iDCs at the indicated ratios (NK/DC) in the presence (▴) or absence (▵) of 10 ng/ml of LPS. NK cell activation was determined by the percentage of cells expressing CD69. (E–G) Flow cytometry dot plots from a representative experiment measuring NK cell activation marker expression (CD69 and CD25). NK cells were incubated for 18 h: alone (E), with iDCs at an NK/DC ratio of 1:5 (F), or with iDCs (NK/DC, 1:5), but separated in trans-wells (G).
Figure 2.
Figure 2.
Activated/cultured NK cell–mediated amplification/inhibition of DC cytokine production. Results are presented on log scales. Cultured iDCs were incubated alone or with cultured/purified NK cells for 24 h (A and B) or 48 h (C–E) in the presence or absence of the indicated concentrations of LPS. After culture the supernatants were removed and analyzed by ELISA for TNF-α or IL-12 p40. (A) TNF-α production was measured in the supernatants from cultures of: DCs alone (gray bars); NK+DC (1:5) (black bars). LPS concentrations used were: 0, 10, and 1,000 ng/ml (DCs alone only). (B) Contact-dependent stimulation of iDC TNF-α production by NK cells was tested under the following conditions: DCs alone (gray bars); NK+DC (1:5) (black bars); NK/DC (1:5) trans-wells (striped bars). LPS concentrations used were: 10 ng/ml (donor 1) and 20 ng/ml (donor 2). (C and D) Effect of increasing the NK/DC ratio (DCs alone; NK:DC-1:5; 1:1; 5:1) on (C) TNF-α and (D) IL-12 p40 production. LPS concentrations used were: 0 ng/ml (▪); 20 ng/ml (•); 50 ng/ml (▴); and 1,000 ng/ml-LPS (□) (DCs alone only). (E) The effect of neutralizing IFN-γ production was tested under the following conditions: DCs alone (gray bars); NK+DC (1:5) (black bars); NK+DC (1:5) and 10 μg/ml of blocking anti–IFN-γ mAb (stippled bars). LPS concentrations used were: 0 ng/ml (NO LPS) and 20 ng/ml (LPS 20).
Figure 3.
Figure 3.
Activated/cultured NK cell–mediated death/survival of DCs and NK–DC conjugate formation. NK cell mediated killing/survival of CFDA.SE-loaded iDCs (A) and K562 cells (B) was measured by flow cytometry over 4 h (▪) or 24 h (•) at the indicated NK/DC ratios as described in Materials and Methods. Results are presented as percentage of specific lysis ± SEM (n = 3 independent experiments). NK–DC (C–E) or NK–K562 (F–H) conjugate formation was measured by flow cytometry, at the following ratios (NK/DC or NK/K562): 1:5 (C and F); 1:1 (D and G); and 5:1 (E and H). Snarf-1 (FL3)-labeled iDCs or K562 cells were incubated (30 min) with CFDA.SE (FL1)-labeled NK cells at the different ratios. The percentage of conjugates formed (top right quadrant) was calculated by determining the percentage of FL3+ (Snarf-1) events which were also positive for FL1 (CFDA.SE). The results are representative of four experiments performed with activated NK cells. Resting NK cells also readily formed conjugates with autologous iDCs (data not shown).
Figure 3.
Figure 3.
Activated/cultured NK cell–mediated death/survival of DCs and NK–DC conjugate formation. NK cell mediated killing/survival of CFDA.SE-loaded iDCs (A) and K562 cells (B) was measured by flow cytometry over 4 h (▪) or 24 h (•) at the indicated NK/DC ratios as described in Materials and Methods. Results are presented as percentage of specific lysis ± SEM (n = 3 independent experiments). NK–DC (C–E) or NK–K562 (F–H) conjugate formation was measured by flow cytometry, at the following ratios (NK/DC or NK/K562): 1:5 (C and F); 1:1 (D and G); and 5:1 (E and H). Snarf-1 (FL3)-labeled iDCs or K562 cells were incubated (30 min) with CFDA.SE (FL1)-labeled NK cells at the different ratios. The percentage of conjugates formed (top right quadrant) was calculated by determining the percentage of FL3+ (Snarf-1) events which were also positive for FL1 (CFDA.SE). The results are representative of four experiments performed with activated NK cells. Resting NK cells also readily formed conjugates with autologous iDCs (data not shown).
Figure 4.
Figure 4.
Activated/cultured NK cell–mediated maturation/death of DCs. Cultured iDCs were incubated for 48 h, alone (A–C), or with NK cells at the following ratios (NK/DC), 1:5 (D–F), 1:1 (G–I), and 5:1 (J–L). Forward versus side scatter plots (A, D, G, and J) show the gating on the DC subset and demonstrate its disappearance at the 5:1 (NK/DC) ratio (J). Propidium iodide staining of the NK/DC (5:1) cultures confirmed the almost complete absence of viable DCs (data not shown). Staining for CD86 expression was performed as described in Fig. 1 and the histograms are shown for DCs cultured in the presence (C, F, I, and L) or absence (B, E, H, and K) of 1 ng/ml of LPS. Results are representative of six experiments performed.
Figure 5.
Figure 5.
Activated/cultured NK cell-induced DC maturation is dependent on cell-to-cell contact and endogenous TNF-α production. Cultured iDCs were incubated alone (A, D, and G); with activated NK cells at an NK/DC ratio of 1:5 (B, E, and H); with activated NK cells (NK/DC; 1:5) separated in trans-wells (C and F); or with activated NK cells and 10 μg/ml of a neutralizing antibody for TNF-α (I). LPS concentrations used were: 0 ng/ml (A–C); 10 ng/ml (D–F) and 50 ng/ml (G–I). CD86 staining of the DC subset was performed as in Figs. 1 and 4. Results are representative of four experiments performed.

References

    1. Banchereau, J., and R. Steinman. 1998. Dendritic cells and the control of immunity. Nature. 392:245–252. - PubMed
    1. Scott, P., and G. Trinchieri. 1995. The role of natural killer cells in host-parasite interactions. Curr. Opin. Immunol. 7:34–40. - PubMed
    1. Cella, M., F. Sallusto, and A. Lanzavecchia. 1997. Origin, maturation and antigen presenting function of dendritic cells. Curr. Opin. Immunol. 9:10–16. - PubMed
    1. Trinchieri, G. 1989. Biology of natural killer cells. Adv. Immunol. 47:187–376. - PMC - PubMed
    1. Sanchez, M.J., M.O. Muench, M.G. Roncarolo, L.L. Lanier, and J.H. Phillips. 1994. Identification of a common T/natural killer cell progenitor in human fetal thymus. J. Exp. Med. 180:569–576. - PMC - PubMed