Comparative Study
. 2002 Feb 5;99(3):1562-7.
doi: 10.1073/pnas.032667699.

DNA microarray analysis of differential gene expression in Borrelia burgdorferi, the Lyme disease spirochete

Affiliations
Comparative Study

DNA microarray analysis of differential gene expression in Borrelia burgdorferi, the Lyme disease spirochete

Andrew T Revel et al. Proc Natl Acad Sci U S A. .

Abstract

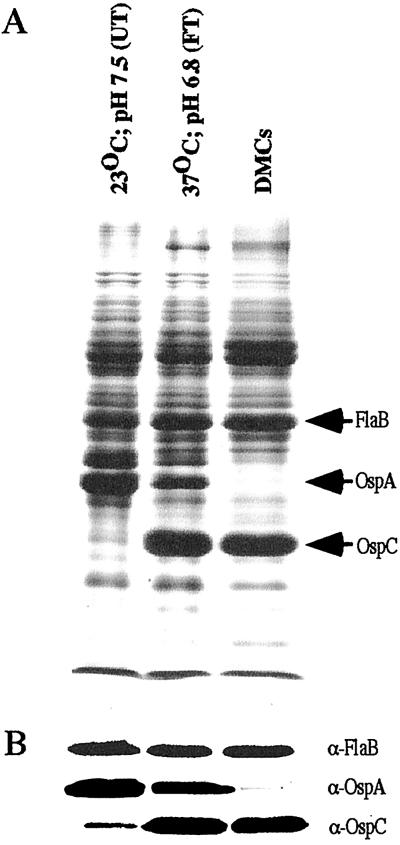
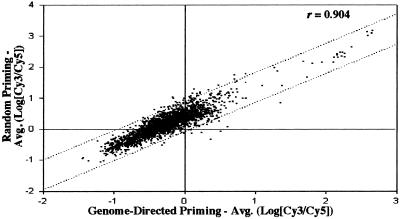
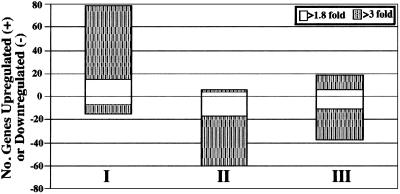
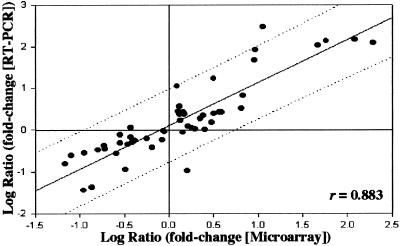
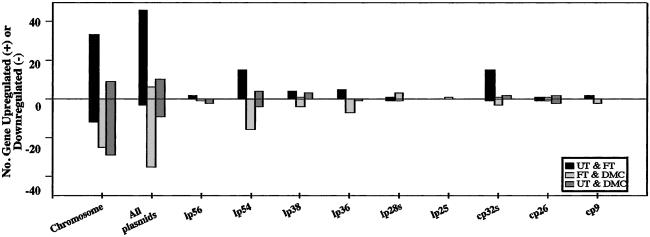
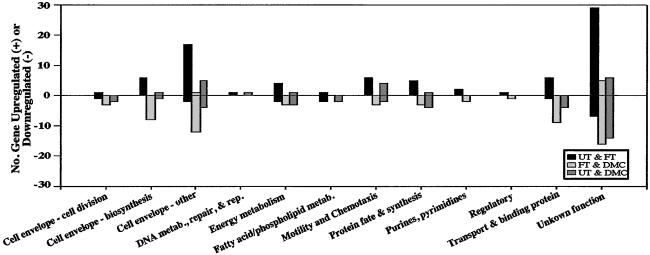
DNA microarrays were used to survey the adaptive genetic responses of Borrelia burgdorferi (Bb) B31, the Lyme disease spirochete, when grown under conditions analogous to those found in unfed ticks (UTs), fed ticks (FTs), or during mammalian host adaptation (Bb in dialysis membrane chambers implanted in rats). Microarrays contained 95.4% of the predicted B31 genes, 150 (8.6%) of which were differentially regulated (changes of > or = 1.8-fold) among the three growth conditions. A substantial proportion (46%) of the differentially regulated genes encoded proteins with predicted export signals (29% from predicted lipoproteins), emphasizing the importance to Bb of modulating its extracellular proteome. For B31 cultivated at the more restrictive UT condition, microarray data provided evidence of a bacterial stringent response and factors that restrict cell division. A large proportion of genes were responsive to the FT growth condition, wherein increased temperature and reduced pH were prominent environmental parameters. A surprising theme, supported by cluster analysis, was that many of the gene expression changes induced during the FT growth condition were transient and largely tempered as B31 adapted to the mammalian host, suggesting that once Bb gains entry and adapts to mammalian tissues, fewer differentially regulated genes are exploited. It therefore would seem that although widely dissimilar, the UT and dialysis membrane chamber growth conditions promote more static patterns of gene expression in Bb. The microarray data thus provide a basis for formulating new testable hypotheses regarding the life cycle of Bb and attaining a more complete understanding of many aspects of Bb's complex parasitic strategies.


Figures

Figure 1
Figure 1
SDS/PAGE (Coomassie blue stain) (A) and immunoblot (B) of whole-cell lysates of B31 cultivated at the UT, FT, and DMC conditions. The arrows at the right denote the migration of FlaB (loading control), OspA, and OspC.
Figure 2
Figure 2
Correlation of Cy3/Cy5 fluorescence intensities of Cy3-labeled cDNA derived by either random priming or using B31-specific GDPs. The dotted lines represent data within 2 SDs of regression (95% confidence). r, correlation coefficient for the similarity between mean log ratios for each feature from the different labeling protocols.
Figure 3
Figure 3
Number of genes differentially expressed during various B31 culture conditions. The UT growth condition was used as a baseline reference. The bars reflect comparisons between the UT and FT (I), FT and DMC (II), and UT and DMC (III) growth conditions. The white areas denote gene expression changes of 1.8–3.0-fold, whereas shaded areas signify changes >3-fold. Individual gene listings are provided in Tables 3–5.
Figure 4
Figure 4
Correlation between microarray and real-time RT-PCR data. Log-transformed fold changes for 16 differentially expressed genes and one constitutively expressed gene (flaB; Table 2) were compared at each of the three (UT, FT, and DMC) growth conditions. The dotted lines represent data within 2 SDs of regression (95% confidence). r, correlation coefficient.
Figure 5
Figure 5
Number and distribution of differentially expressed genes among B31 genetic replicons. The UT growth condition was used as a baseline reference. The bars reflect comparisons between the UT and FT (black), FT and DMC (light gray), and UT and DMC (dark gray) growth conditions. Individual gene listings are provided in Tables 3–5.
Figure 6
Figure 6
Number of differentially expressed genes grouped by putative protein functions. The UT growth condition was used as a baseline reference. The bars reflect comparisons between the UT and FT (black), FT and DMC (light gray), and UT and DMC (dark gray) growth conditions. Individual gene listings are provided in Tables 3–5.

References

    1. Steere A C. Hosp Pract. 1993;28:37–44. - PubMed
    1. Schwan T G, Piesman J, Golde W T, Dolan M C, Rosa P A. Proc Natl Acad Sci USA. 1995;92:2909–2913. - PMC - PubMed
    1. de Silva A M, Telford S R, Brunet L R, Barthold S W, Fikrig E. J Exp Med. 1996;183:271–275. - PMC - PubMed
    1. Gilmore R D, Piesman J. Infect Immun. 2000;68:411–414. - PMC - PubMed
    1. Schwan T G, Piesman J. J Clin Microbiol. 2000;38:382–388. - PMC - PubMed

Publication types

LinkOut - more resources