. 2002 Feb;15(2):95-111.
doi: 10.1002/hbm.10010.

Cortical sources of the early components of the visual evoked potential

Affiliations

Cortical sources of the early components of the visual evoked potential

Francesco Di Russo et al. Hum Brain Mapp. 2002 Feb.

Abstract

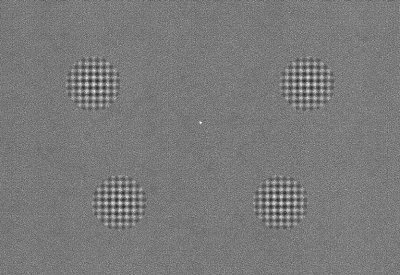
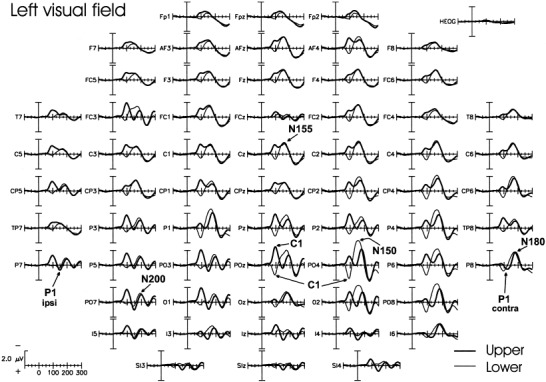
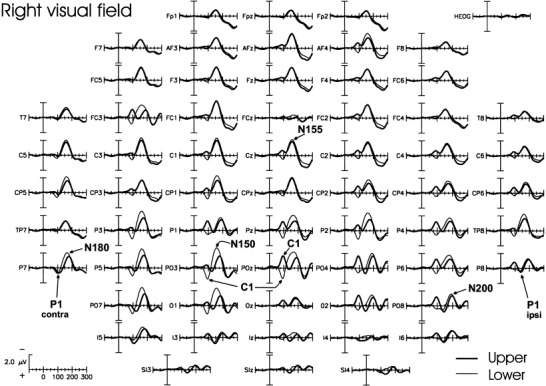
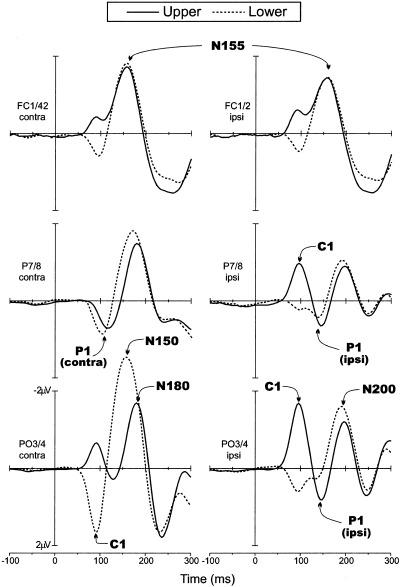
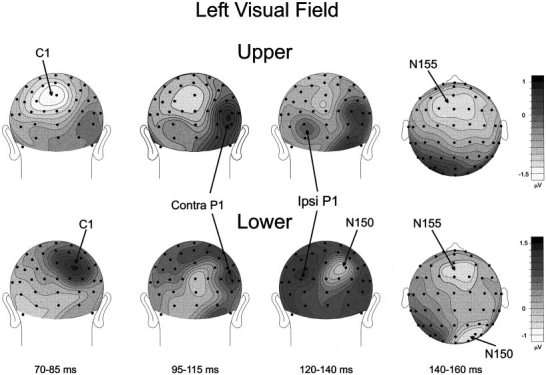
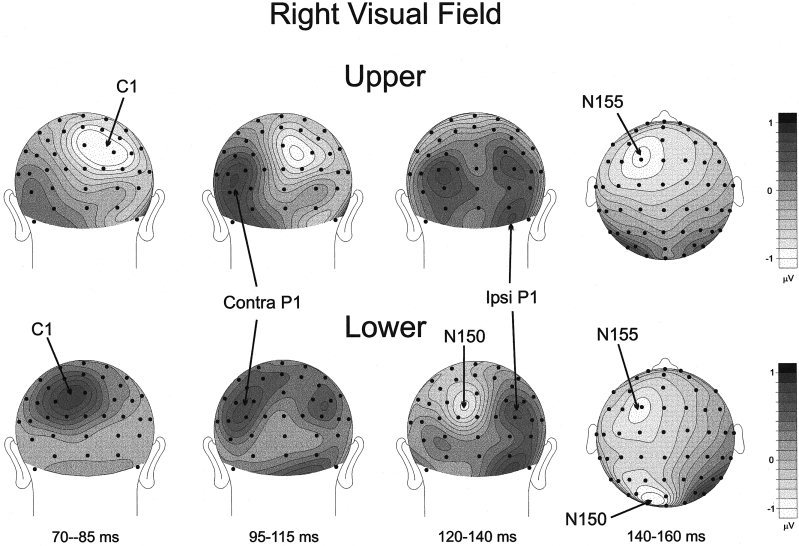
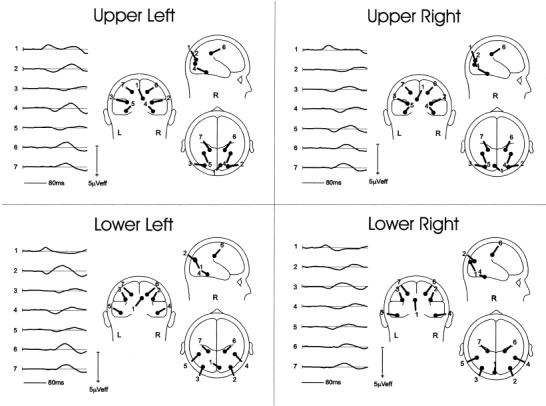
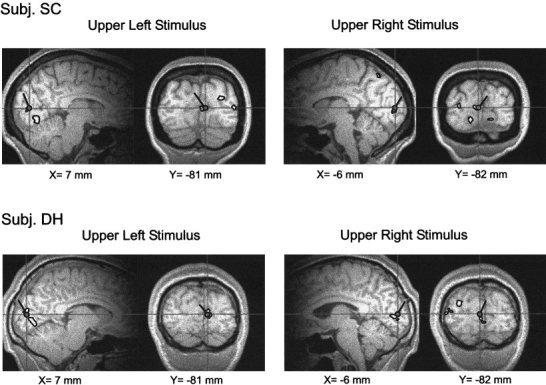
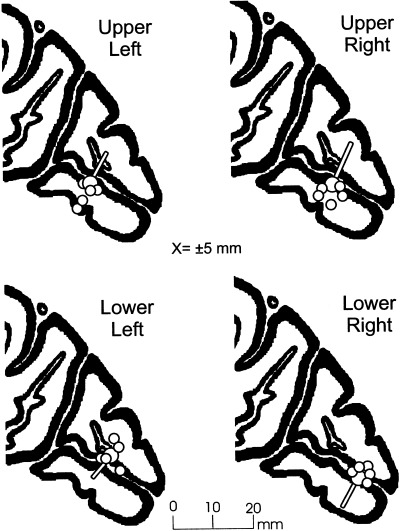
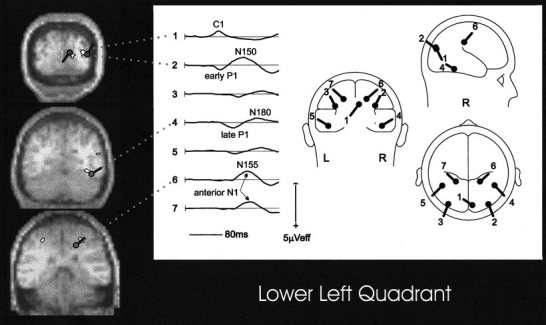
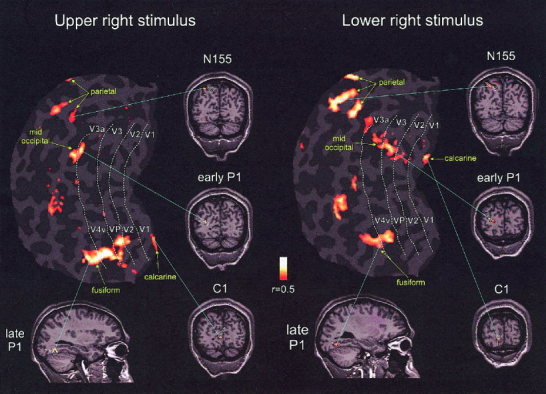
This study aimed to characterize the neural generators of the early components of the visual evoked potential (VEP) to isoluminant checkerboard stimuli. Multichannel scalp recordings, retinotopic mapping and dipole modeling techniques were used to estimate the locations of the cortical sources giving rise to the early C1, P1, and N1 components. Dipole locations were matched to anatomical brain regions visualized in structural magnetic resonance imaging (MRI) and to functional MRI (fMRI) activations elicited by the same stimuli. These converging methods confirmed previous reports that the C1 component (onset latency 55 msec; peak latency 90-92 msec) was generated in the primary visual area (striate cortex; area 17). The early phase of the P1 component (onset latency 72-80 msec; peak latency 98-110 msec) was localized to sources in dorsal extrastriate cortex of the middle occipital gyrus, while the late phase of the P1 component (onset latency 110-120 msec; peak latency 136-146 msec) was localized to ventral extrastriate cortex of the fusiform gyrus. Among the N1 subcomponents, the posterior N150 could be accounted for by the same dipolar source as the early P1, while the anterior N155 was localized to a deep source in the parietal lobe. These findings clarify the anatomical origin of these VEP components, which have been studied extensively in relation to visual-perceptual processes.


Figures

Figure 1
Figure 1
Stimuli used in this experiment. Circular sinusoidal checkerboards were flashed one at time in random order to the four locations.
Figure 2
Figure 2
Grand average VEPs to stimuli located in the upper (thick line) and lower (thin line) quadrants of the left visual field.
Figure 3
Figure 3
Same as in Figure 2 for the right visual field.
Figure 4
Figure 4
Grand average VEPs in response to upper (solid line) and lower hemifield (dashed line) stimuli. Waveforms are collapsed across VEPs to left and right hemifield stimuli and are plotted separately for scalp sites contralateral (left) and ipsilateral (right) to the side of stimulation.
Figure 5
Figure 5
Spline‐interpolated voltage maps of VEP components elicited by LVF stimuli in the latency range of C1 (70–85 msec), early P1 (95–115 msec), late P1 (120–140) and N1 (140–160 msec) components.
Figure 6
Figure 6
Same as in Figure 5 except for the RVF.
Figure 7
Figure 7
BESA dipole models fitted to the grand‐average VEPs to stimuli in the four visual field quadrants. Waveforms at the left of each model show the time course of source activity for each of the modeled dipoles. Dipole 1 corresponds to the C1 component, dipole pair 2‐3 to the early P1, dipole pair 4‐5 to the late P1, and dipole pair 6‐7 to the N155.
Figure 8
Figure 8
Spatial correspondence between dipole models fitted to the grand average VEP for the C1 component (circle with pointer) and sites of activation in calcarine fissure shown by fMRI in response to the same stimuli in two individual subjects.
Figure 9
Figure 9
Anatomical correspondence between the modeled dipoles for the C1 component (large circles with pointers) and sites of activation in the calcarine fissure shown by fMRI (small circles) in response to the same stimuli in 5 individual subjects. In these saggital views both the dipole positions and the centers of calcarine activation are shown in Talairach space.
Figure 10
Figure 10
Spatial correspondence between dipole models fitted to the grand‐average VEP and sites of activation in the grand‐average fMRI in response to stimuli in the lower left quadrant. For the late P1 and N155 the dipole locations were situated anteriorly to the plane of the MRI/fMRI section by 15 and 8 mm, respectively. See Tables III and IV for data from all 4 quadrants.
Figure 11
Figure 11
Spatial correspondence between dipole models fitted to the grand average VEP and fMRI activations in a single subject (KD). fMRI activations and retinotopic mappings of visual areas for upper and lower right field stimuli were projected onto a flattened cortical representation of the left hemisphere. Dashed white lines represent the boundaries of visual areas traced from visual field sign maps (sulcal cortex, dark gray; gyral cortex, light gray). Coronal and saggital sections display the same activations before flattening. The circles with pointers indicate the fitted dipoles from the grand‐average VEP model in response to the same stimuli.

Similar articles

Cited by

References

    1. Aine CJ, Supek S, George JS (1995): Temporal dynamics of visual‐evoked neuromagnetic sources: effects of stimulus parameters and selective attention. Int J Neurosci 80: 79–104. - PubMed
    1. Aine CJ, Supek S, George JS, Ranken D, Lewine J, Sanders J, Best E, Tiee W, Flynn ER, Wood CC (1996): Retinotopic organization of human visual cortex: departures from the classical model. Cereb Cortex 6: 354–361. - PubMed
    1. Anllo‐Vento L, Luck SJ, Hillyard SA (1998): Spatio‐temporal dynamics of attention to color: evidences from human electrophysiology. Hum Brain Mapp 6: 216–238. - PMC - PubMed
    1. Biersdorf WR (1974): Cortical evoked responses from stimulation of various regions of the visual field. Doc Ophthalmol Proc 3: 247–259.
    1. Bodis‐Wollner I, Brannan JR, Nicoll J, Frkovic S, Mylin LH (1992): A short latency cortical component of the foveal VEP is revealed by hemifield stimulation. Electroencephalogr Clin Neurophysiol 84: 201–208. - PubMed

LinkOut - more resources