

Bias in estimates of quantitative-trait-locus effect in genome scans: demonstration of the phenomenon and a method-of-moments procedure for reducing bias
- PMID: 11836648
- PMCID: PMC384937
- DOI: 10.1086/339273
Bias in estimates of quantitative-trait-locus effect in genome scans: demonstration of the phenomenon and a method-of-moments procedure for reducing bias
Abstract
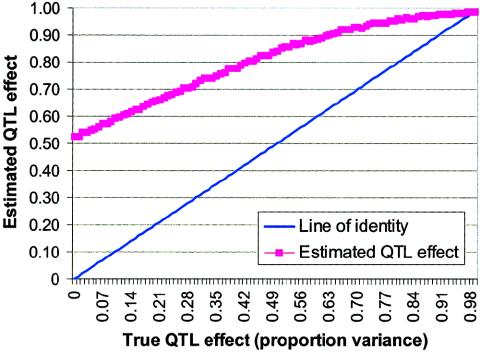
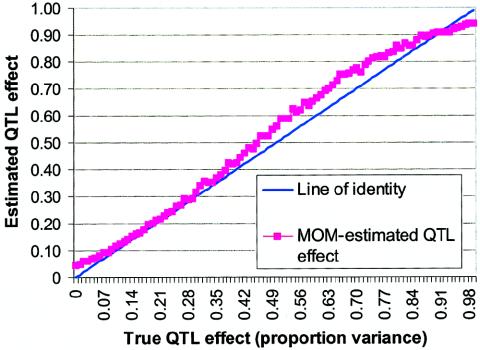
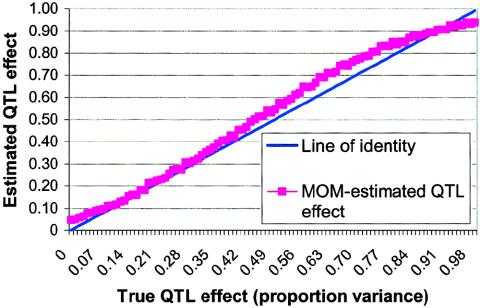
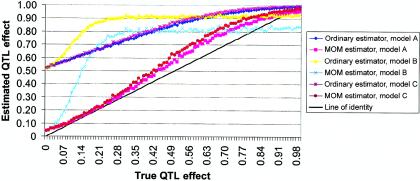
An attractive feature of variance-components methods (including the Haseman-Elston tests) for the detection of quantitative-trait loci (QTL) is that these methods provide estimates of the QTL effect. However, estimates that are obtained by commonly used methods can be biased for several reasons. Perhaps the largest source of bias is the selection process. Generally, QTL effects are reported only at locations where statistically significant results are obtained. This conditional reporting can lead to a marked upward bias. In this article, we demonstrate this bias and show that its magnitude can be large. We then present a simple method-of-moments (MOM)-based procedure to obtain more-accurate estimates, and we demonstrate its validity via Monte Carlo simulation. Finally, limitations of the MOM approach are noted, and we discuss some alternative procedures that may also reduce bias.
Figures

References
-
- Beavis WD (1998) QTL analysis: power, precision, and accuracy. In: Paterson AH (ed) Molecular dissection of complex traits. CRC Press, Boca Raton, FL, pp 145–173
-
- Blangero J, Almasy L (1997) Multipoint oligogenic linkage analysis of quantitative traits. Genet Epidemiol 14:959–964 - PubMed
-
- Carlin BP, Louis TA (2000a) Bayes and empirical Bayes methods for data analysis, 2d ed. CRC Press, Boca Raton, FL
Publication types
MeSH terms
Grants and funding
LinkOut - more resources
Full Text Sources
Medical
