. 2002 Feb 15;30(4):983-92.
doi: 10.1093/nar/30.4.983.

Complete disproportionation of duplex poly(dT)*poly(dA) into triplex poly(dT)*poly(dA)*poly(dT) and poly(dA) by coralyne

Affiliations

Complete disproportionation of duplex poly(dT)*poly(dA) into triplex poly(dT)*poly(dA)*poly(dT) and poly(dA) by coralyne

Matjaz Polak et al. Nucleic Acids Res. .

Abstract

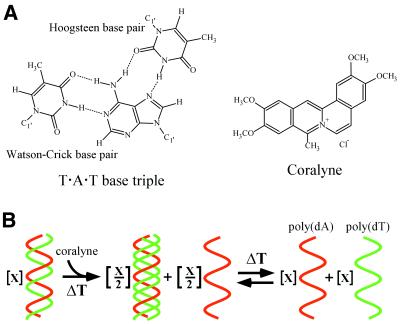
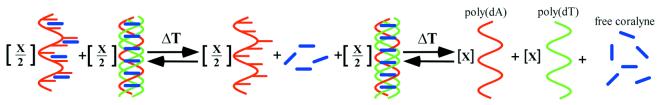
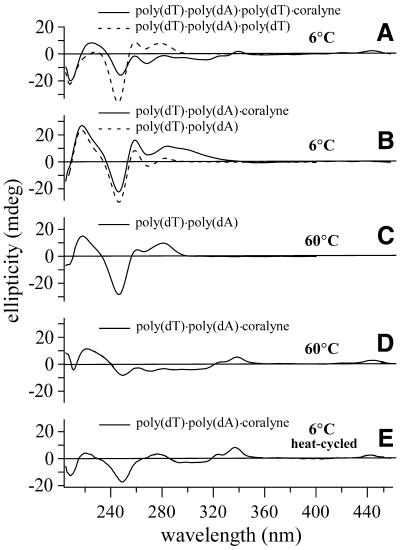
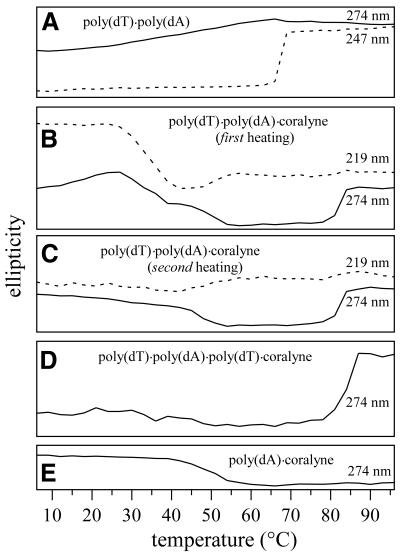
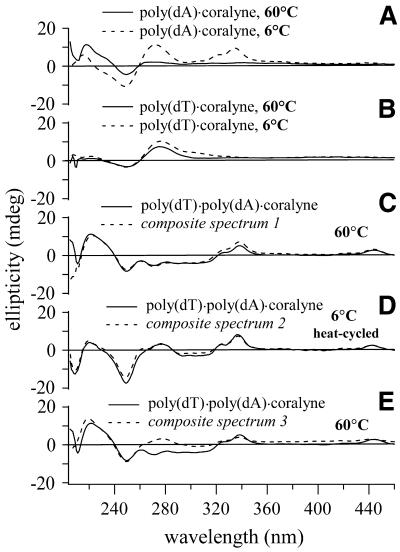
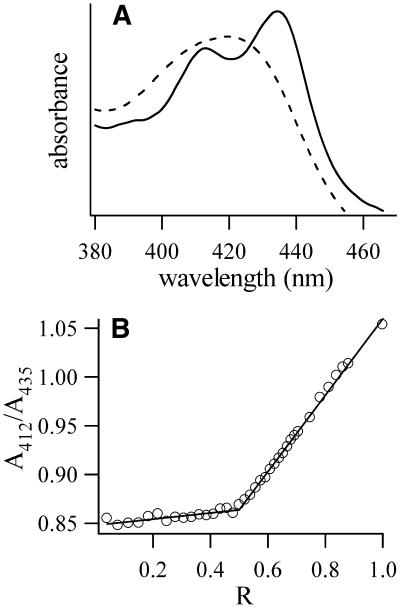
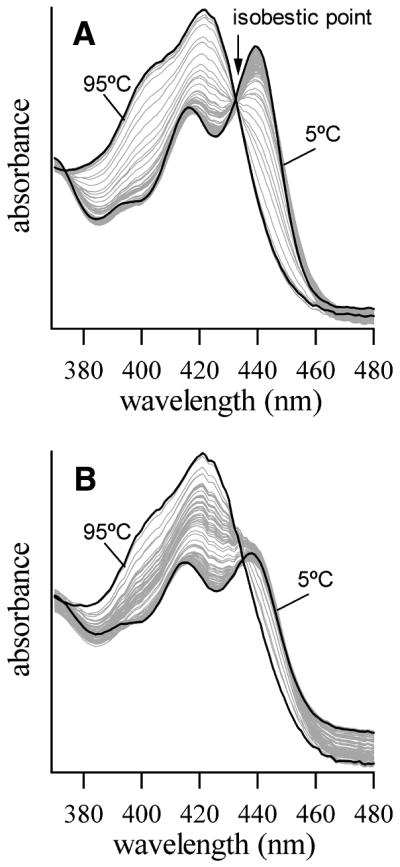
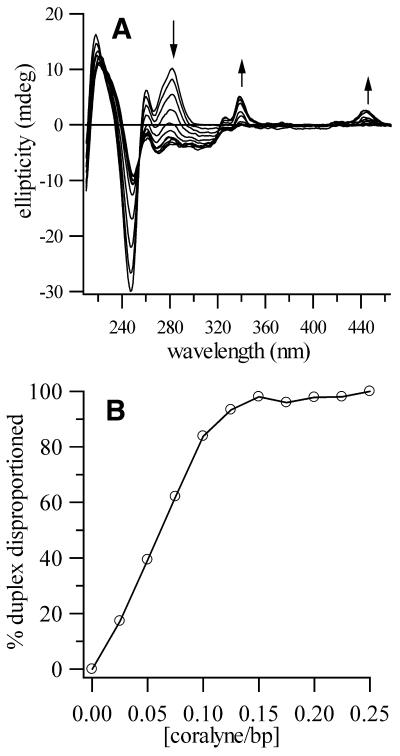
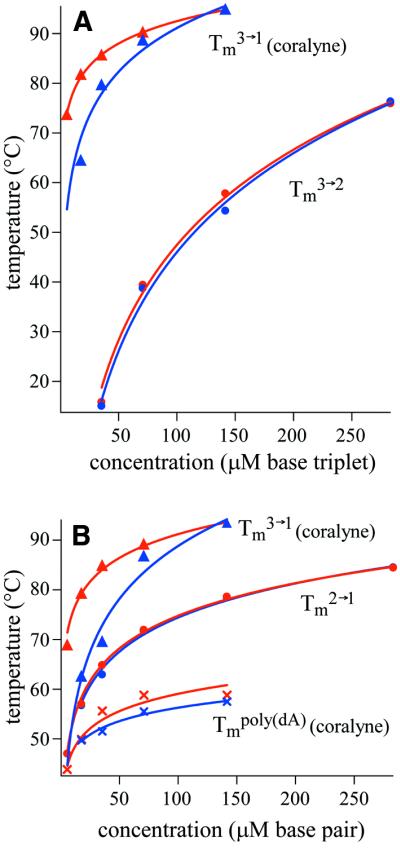
Coralyne is a small crescent-shaped molecule known to intercalate duplex and triplex DNA. We report that coralyne can cause the complete and irreversible disproportionation of duplex poly(dT)*poly(dA). That is, coralyne causes the strands of duplex poly(dT)*poly(dA) to repartition into equal molar equivalents of triplex poly(dT)*poly(dA)*poly(dT) and poly(dA). Poly(dT)*poly(dA) will remain as a duplex for months after the addition of coralyne, if the sample is maintained at 4 degrees C. However, disproportionation readily occurs upon heating above 35 degrees C and is not reversed by subsequent cooling. A titration of poly(dT)*poly(dA) with coralyne reveals that disproportionation is favored by as little as one molar equivalent of coralyne per eight base pairs of initial duplex. We have also found that poly(dA) forms a self-structure in the presence of coralyne with a melting temperature of 47 degrees C, for the conditions of our study. This poly(dA) self-structure binds coralyne with an affinity that is comparable with that of triplex poly(dT)*poly(dA)*poly(dT). A Job plot analysis reveals that the maximum level of poly(dA) self-structure intercalation is 0.25 coralyne molecules per adenine base. This conforms to the nearest neighbor exclusion principle for a poly(dA) duplex structure with A*A base pairs. We propose that duplex disproportionation by coralyne is promoted by both the triplex and the poly(dA) self-structure having binding constants for coralyne that are greater than that of duplex poly(dT)*poly(dA).


Figures

None
Scheme 1. (A) Structural representations of the T·A·T base triplet and coralyne chloride. (B) Schematic representation of the irreversible disproportionation of uplex poly(dT)·poly(dA) into triplex poly(dT)·poly(dA)·poly(dT) and poly(dA) by heating in the presence of coralyne chloride. The coralyne-intercalated poly(dT)·poly(dA)·poly(dT) triplex can be melted and reformed by heating and cooling, but the duplex is not reformed.
None
Scheme 2. The proposed three-state melting of a disproportioned poly(dT)·poly(dA)·coralyne sample. Although coralyne-intercalated poly(dA) is depicted as being single stranded, our data indicates that coralyne-intercalated poly(dA) exists as a base-paired duplex structure.
None
Scheme 2. The proposed three-state melting of a disproportioned poly(dT)·poly(dA)·coralyne sample. Although coralyne-intercalated poly(dA) is depicted as being single stranded, our data indicates that coralyne-intercalated poly(dA) exists as a base-paired duplex structure.
Figure 1
Figure 1
CD spectra of duplex and triplex DNA samples that demonstrate the irreversible structural transition of poly(dT)·poly(dA) upon heating in the presence of coralyne. (A) Spectra of poly(dT)·poly(dA)·poly(dT) triplex with and without coralyne at 6°C. (B) Spectra of duplex poly(dT)·poly(dA) without coralyne and after the addition of coralyne at 6°C (prior to heating). (C and D) Spectra of poly(dT)·poly(dA) at 60°C without and with coralyne added, respectively. (E) Spectrum of the same sample shown in (D), after heating to 95°C and cooling back to 6°C. All samples were 55 µM base pair or base triplet. Coralyne concentrations, in samples containing coralyne, were 0.25 molar equivalents/base pair for poly(dT)·poly(dA) samples; 0.5 molar equivalents/base triplet for poly(dT)·poly(dA)·poly(dT) samples.
Figure 2
Figure 2
CD melting profiles at wavelengths selected for optimum visualization of structural transitions, and for comparisons between samples. (A) Poly(dT)·poly(dA); the duplex melting transition (Tm2→1) is observed at 68°C. (B) First heating of poly(dT)·poly(dA) after the addition of coralyne; the duplex disproportionation transition is observed at 35°C, melting of the poly(dA) self-structure (Tmpoly(dA)) at 47°C, and triplex melting (Tm3→1) at 82°C. (C) Second heating of poly(dT)·poly(dA) after the addition of coralyne; the melting transition of the poly(dA) self-structure (Tmpoly(dA)) is observed at 47°C, and triplex melting (Tm3→1) at 82°C. (D) Poly(dT)·poly(dA)·poly(dT) with coralyne; triplex melting (Tm3→1) is observed at 84°C. (E) Poly(dA) with coralyne; melting transition of the poly(dA) self-structure (Tmpoly(dA)) is observed at 47°C. Vertical ellipticity scale is the same for all melting profiles. Samples were 55 µM nucleotide, base pair or base triplet, respectively. Coralyne concentrations, in samples containing coralyne, were 0.25 molar equivalents/base pair for poly(dT)·poly(dA) and poly(dA) samples; 0.5 molar equivalents/base triplet for poly(dT)·poly(dA)·poly(dT) samples.
Figure 3
Figure 3
CD spectra of single-stranded poly-nucleotide and disproportioned duplex samples in the presence of coralyne. (A) Poly(dA) with coralyne at 6 and 60°C. (B) Poly(dT) with coralyne at 6 and 60°C. (C) Spectrum of poly(dT)·poly(dA) with coralyne at 60°C and composite spectrum 1 {summation of spectra acquired at 60°C: 0.5 × [poly(dT)·poly(dA)·poly(dT) with 0.5 molar equivalents of coralyne per base triplet] + 0.5 × [poly(dA)]}. (D) Spectrum of poly(dT)·poly(dA) with coralyne at 6°C, after heating to 95°C (i.e. heat-cycled), and composite spectrum 2 {summation of spectra acquired at 6°C: 0.5 × [poly(dT)·poly(dA)·poly(dT) with coralyne] + 0.5 × [poly(dA) with coralyne]}. (E) Spectrum of poly(dT)·poly(dA) with coralyne at 60°C and composite spectrum 3 {summation of spectra acquired at 60°C: 0.5 × [poly(dT)·poly(dA)·poly(dA) with coralyne] + 0.5 × [poly(dT) with coralyne]}. All samples were 55 µM nucleotide, base pair or base triplet. Coralyne concentrations, unless stated explicitly, were 0.25 molar equivalents/base, base pair or base triplet.
Figure 4
Figure 4
(A) The 380–470 nm region of coralyne absorption spectra. Dashed line is 12 µM coralyne. Solid line is 12 µM coralyne with poly(dA) at 150 µM adenine base. (B) A continuous fraction analysis (Job plot) of poly(dA) with coralyne. A412/A435 is the ratio of the absorbance of coralyne at 412 versus 435 nm. R = [coralyne]/([coralyne] + [poly(dA) in nucleotides/4]). Total concentration of coralyne and poly(dA) (in nucleotides/4) was held constant at 50 µM over the course of titration. The change in curve slope at 0.5 represents a change in the local environment of coralyne at a ratio of one coralyne molecule per four adenine nucleotides. For both (A) and (B) sample conditions were 115 mM NaCl, 13 mM Na-cacodylic buffer, pH 6.8, 22°C.
Figure 5
Figure 5
The 370–480 nm region of coralyne absorption spectra for two DNA samples over the course of heating from 5 to 95°C. Spectra acquired at 5 and 95°C are shown in black. Spectra acquired at intervening temperatures, in increments of 2°C, are shown in gray. (A) Coralyne spectra in the presence of poly(dT)·poly(dA)·poly(dT). The isobestic point indicates that coralyne experiences only two environments over the course of triplex melting (i.e. intercalated and free in solution). (B) Coralyne spectra in the presence of disproportioned (previously heat-cycled) poly(dT)·poly(dA). DNA concentration was 142 µM in base triplet and base pair for the samples of (A) and (B), respectively. Coralyne concentration was 70.8 µM in both samples.
Figure 6
Figure 6
Results from a titration of poly(dT)·poly(dA) with coralyne to determine the minimum concentration of coralyne required for duplex disproportionation. (A) Spectra of a poly(dT)·poly(dA) sample, 55 µM base pair, from no added coralyne to 13.8 µM coralyne. Each spectra corresponds to an increase in coralyne concentration of 1.38 µM (i.e. 0.025 equivalents of coralyne per base pair of original duplex). Following each addition of coralyne the sample was heated to 95°C and then cooled to 60°C. Spectra were collected at 60°C. The initial spectrum is typical of duplex poly(dT)·poly(dA), whereas the final spectrum is that of a completely disproportioned poly(dT)·poly(dA)·coralyne sample. (B) A plot of the percentage of original duplex disproportioned as a function of coralyne concentration. Coralyne concentration is given in terms of molar equivalents of coralyne per base pair of original duplex. The fraction of duplex disproportioned was determined by a least-squares fit of each spectra in (A) with a weighted sum of the initial and final spectra of the titration.
Figure 7
Figure 7
Melting temperatures of DNA secondary structures as a function of sample concentration for duplex and triplex samples, with and without coralyne. Tm values determined from heating ramps are shown in red, Tm values from cooling ramps are shown in blue. (A) Triplex melting temperatures in poly(dT)·poly(dA)·poly(dT) samples. Tm3→2 values for free triplex (without coralyne) are marked with filled circles. Tm3→1 values for triplex samples with coralyne are marked with filled triangles. (B) Melting temperatures of secondary structures in poly(dT)·poly(dA) samples. Tm2→1 values for free duplex (without coralyne) are marked with filled circles. Tm3→1 and Tmpoly(dA) values for the disproportioned duplex samples containing coralyne are marked with filled triangles and crosses, respectively. Curves are logarithmic functions from least-squares fits to experimental data. Logarithmic curves for cooling ramp Tm3→1 in (A) and (B) are extrapolated down to 5.6 µM. Coralyne concentration was 0.5 molar equivalents of coralyne per base triplet, base pair for samples of (A) and (B), respectively.

Similar articles

Cited by

References

    1. Felsenfeld G. and Rich,A. (1957) Studies on the formation of two and three-stranded polyribonucleotides. Biochim. Biophys. Acta, 26, 457–468. - PubMed
    1. Mirkin S.M., Lyamichev,V.I., Drushlyak,K.N., Dobrynin,V.N., Filippov,S.A. and Frankkamenetskii,M.D. (1987) DNA H form requires a homopurine-homopyrimidine mirror repeat. Nature, 330, 495–497. - PubMed
    1. Hanvey J.C., Shimizu,M. and Wells,R.D. (1988) Intramolecular DNA triplexes in supercoiled plasmids. Proc. Natl Acad. Sci. USA, 85, 6292–6296. - PMC - PubMed
    1. Wells R.D., Collier,D.A., Hanvey,J.C., Shimizu,M. and Wohlrab,F. (1988) The chemistry and biology of unusual DNA structures adopted by oligopurine.oligopyrimidine sequences. FASEB J., 2, 2939–2949. - PubMed
    1. Helene C. (1991) The anti-gene strategy: control of gene expression by triplex-forming-oligonucleotides. Anticancer Drug Des., 6, 569–584. - PubMed

Publication types