. 2002 Feb 19;99(4):1972-7.
doi: 10.1073/pnas.032668799. Epub 2002 Feb 12.

Engineering gene expression and protein synthesis by modulation of nuclear shape

Affiliations

Engineering gene expression and protein synthesis by modulation of nuclear shape

Carson H Thomas et al. Proc Natl Acad Sci U S A. .

Abstract

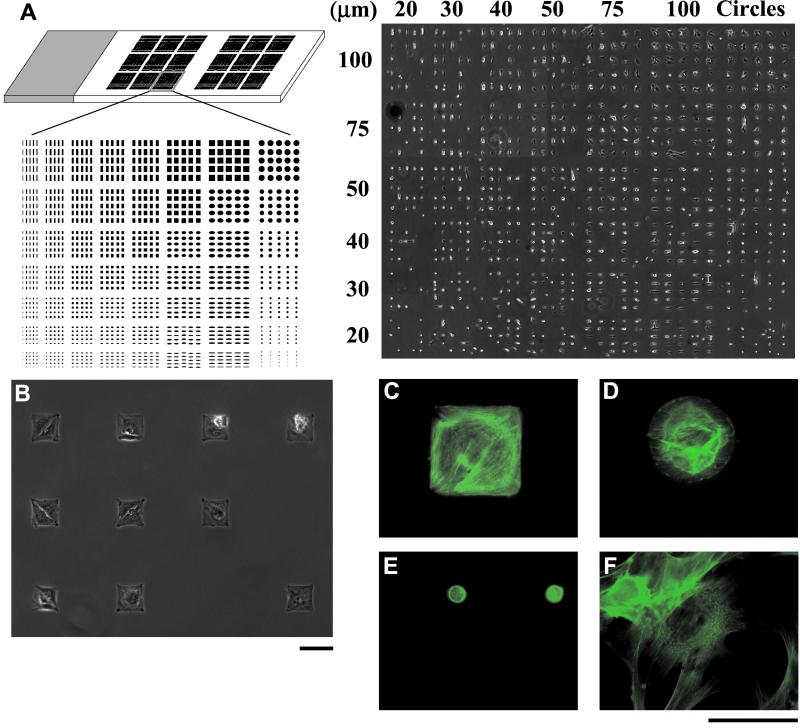
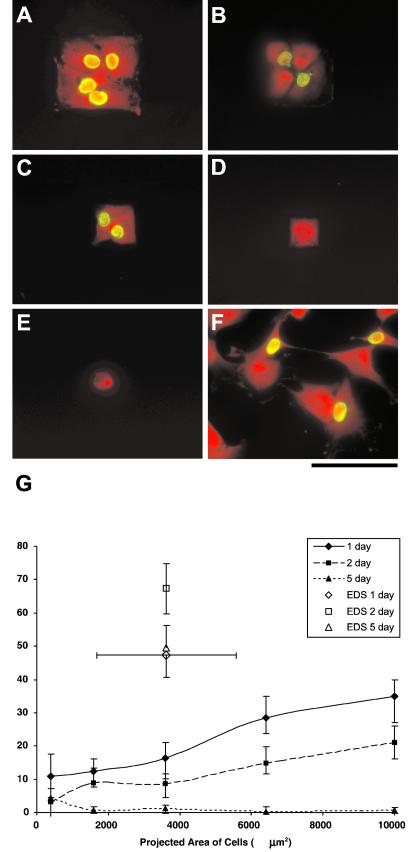
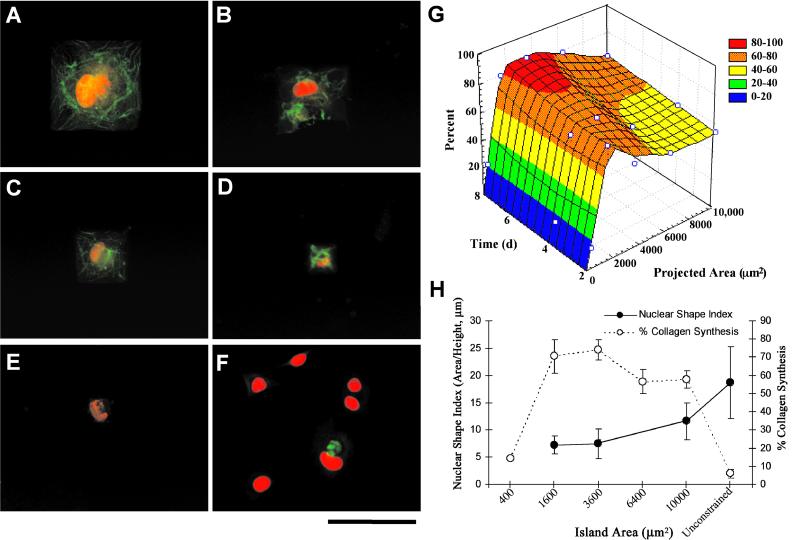
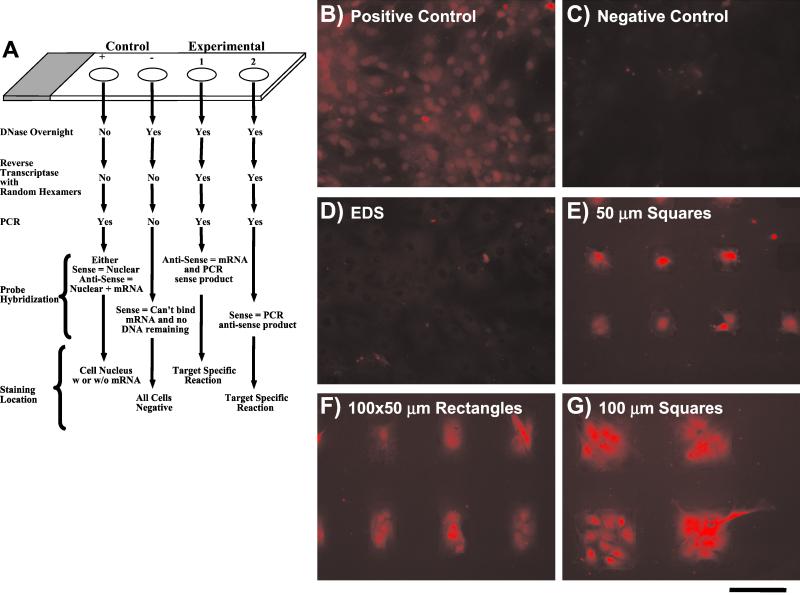
The current understanding of the relationships between cell shape, intracellular forces and signaling, nuclear shape and organization, and gene expression is in its infancy. Here we introduce a method for investigating gene-specific responses in individual cells with controlled nuclear shape and projected area. The shape of the nuclei of primary osteogenic cells were controlled on microfabricated substrata with regiospecific chemistry by confining attachment and spreading of isolated cells on adhesive islands. Gene expression and protein synthesis were altered by changing nuclear shape. Collagen I synthesis correlated directly with cell shape and nuclear shape index (NSI), where intermediate values of nuclear distension (6 < NSI < 8) promoted maximum synthesis. Osteocalcin mRNA, a bone-specific differentiation marker, was observed intracellularly by using reverse transcription in situ PCR at 4 days in cells constrained by the pattern and not detected in unconstrained cells of similar projected area, but different NSI. Our data supports the concept of gene expression and protein synthesis based on optimal distortion of the nucleus, possibly altering transcription factor affinity for DNA, transport to the nucleus, or nuclear matrix organization. The combination of microfabricated surfaces, reverse transcription in situ PCR, and NSI measurement is an excellent system to study how transcription factors, the nuclear matrix, and the cytoskeleton interact to control gene expression and may be useful for studying a wide variety of other cell shape/gene expression relationships.


Figures

Figure 1
Figure 1
(A Left) Multidomain patterning on a 1 × 3-inch glass slide. The array shown is repeated 18 times on the slide. Two groups of nine arrays were patterned so that control RT in situ PCR and hybridization groups could be run on the same slide as experimental groups. (A Right) A montage of phase-contrast images of bone-derived cells patterned on one multidomain array on a 1 × 3-inch glass slide. [Reproduced with permission from ref. (Copyright 1999, American Society of Mechanical Engineers).] (B) Phase-contrast image of individual cells on 80-μm square islands. (CF) Cells stained for F-actin with phalloidin-Oregon green. Cells on large patterns, 100-μm square (C) and 80-μm circle (D), arranged their cytoskeletons to conform to the patterned features, whereas cells seeded on 20-μm circles (E) showed diffuse staining indicative of a disorganized cytoskeleton. (F) Cells seeded on unpatterned EDS surfaces showed organized cytoskeletons, but the orientation was different than those on the constraining islands. (Scale bars = 100 μm.)
Figure 2
Figure 2
Images of cells cultured for 5 days on substrates with square islands with side lengths of (A) 100 μm, (B) 80 μm, (C) 60 μm, (D) 40 μm, and (E) 20 μm, and (F) homogeneous EDS surfaces (unconstrained). Cells were labeled with BrdUrd (green nuclei) to indicate DNA synthesis and counterstained with ethidium homodimer (red) for determination of the number of cells in any given island. Counterstained images were enhanced to illustrate the shape of cells. (Scale bar = 100 μm.) (G) The percentage of islands with only one cell that was actively proliferating versus projected area. Cells were exposed to BrdUrd for 24 h, labeling all cells that proliferated during that exposure period.
Figure 3
Figure 3
After 4 days in culture, immunostaining for CollI (green) was performed on substrates with square islands with side lengths of (A) 100 μm, (B) 80 μm, (C) 60 μm, (D) 40 μm, and (E) 20 μm, and (F) homogeneous EDS surfaces (unconstrained). Ethidium homodimer was used as a nuclear counterstain (red). (Scale bar = 100 μm.) (G) A three-dimensional plot of the percentages of single cells producing CollI are shown versus projected area and time. Cell exposure to patterned adhesive islands between 1,600 and 3,600 μm2 resulted in the highest CollI expression levels. (H) A dual ordinate plot of NSI (area/height), a metric of nuclear spreading, and CollI synthesis indicate an inverse relationship.
Figure 4
Figure 4
(A) Schematic of the steps necessary for the RT in situ PCRs with positive and negative controls. (BG) In situ hybridization for OC after RT-PCR for 4-day cultures. (D) Control homogeneous EDS. (B) Positive RT-PCR/hybridization control, cells on homogeneous EDS. (C) Negative RT-PCR/hybridization control, cells on homogeneous EDS. (EG) cells on patterned surfaces: (E) 50-μm square; (F) 100 × 50-μm rectangle; and (G) 100-μm square. (Scale bar = 100 μm.)

References

    1. Chen C S, Mrksich M, Huang S, Whitesides G M, Ingber D E. Science. 1997;276:1425–1428. - PubMed
    1. Folkman J, Moscona A. Nature (London) 1978;273:345–349. - PubMed
    1. Singhvi R, Kumar A, Lopez G P, Stephanopoulos G N, Wang D I C, Whitesides G M, Ingbar D E. Science. 1994;264:696–698. - PubMed
    1. Watt F M, Jordan P W, O'Neil C H. Proc Natl Acad Sci USA. 1988;85:5576–5580. - PMC - PubMed
    1. Aulthouse A L. Anat Rec. 1994;238:31–37. - PubMed

Publication types

LinkOut - more resources