

Top-down mass spectrometry of a 29-kDa protein for characterization of any posttranslational modification to within one residue
- PMID: 11842225
- PMCID: PMC122269
- DOI: 10.1073/pnas.251691898
Top-down mass spectrometry of a 29-kDa protein for characterization of any posttranslational modification to within one residue
Abstract
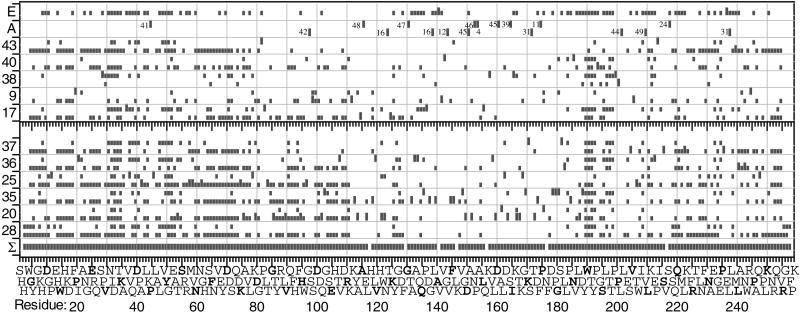
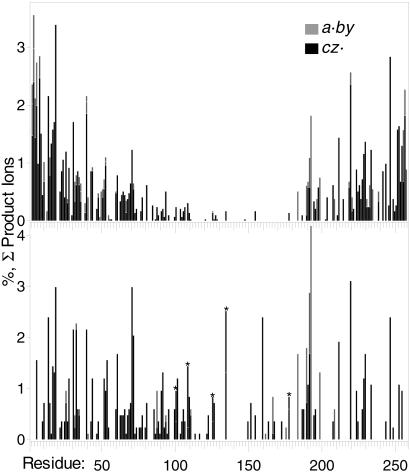
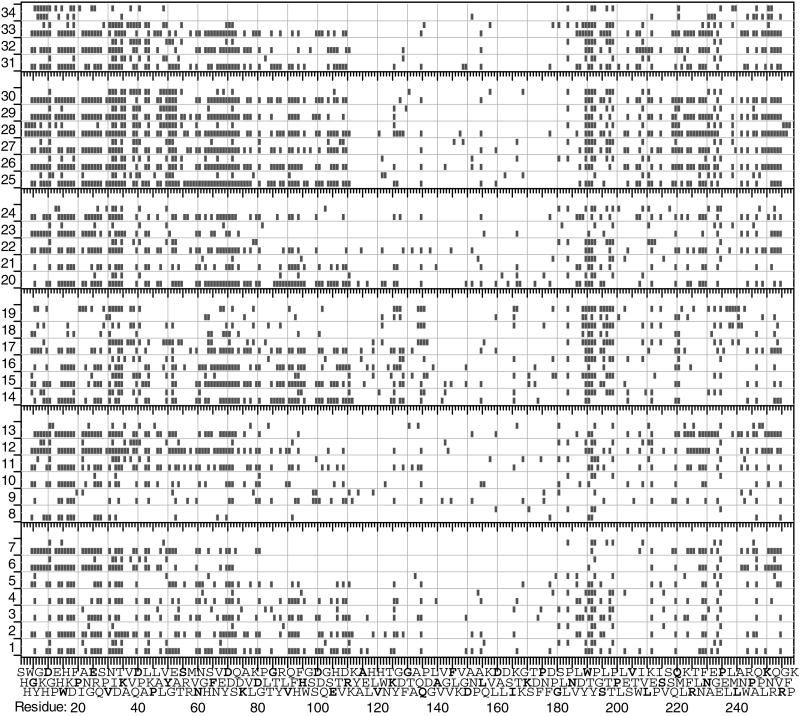
A mass difference between the measured molecular weight of a protein and that of its DNA-predicted sequence indicates sequence errors and/or posttranslational modifications. In the top-down mass spectrometry approach, the measured molecular ion is dissociated, and these fragment masses are matched against those predicted from the protein sequence to restrict the locations of the errors/modifications. The proportion of the ion's interresidue bonds that are cleaved determines the specificity of such locations; previously, ubiquitin (76 residues) was the largest for which all such bonds were dissociated. Now, cleavages are achieved for carbonic anhydrase at 250 of the 258 interresidue locations. Cleavages of three spectra would define posttranslational modifications at 235 residues to within one residue. For 24 of the 34 possible phosphorylation sites, the cleavages of one spectrum would delineate exactly all -PO(3)H substitutions. This result has been achieved with electron-capture dissociation by minimizing the further cleavage of primary product ions and by denaturing the tertiary noncovalent bonding of the molecular ions under a variety of conditions.
Figures
References
-
- Biemann K. Mass Spectrometry. Organic Chemical Applications. New York: McGraw–Hill; 1962. pp. 260–296.
-
- Barber M L, Jolles P, Vilkas E, Lederer E. Biochem Biophys Res Commun. 1965;18:469–473. - PubMed
-
- McLafferty F W, Venkataraghavan R, Irving P. Biochem Biophys Res Commun. 1970;39:274–278. - PubMed
-
- Pandey A, Mann M. Nature (London) 2000;405:837–846. - PubMed
-
- Griffin T J, Han D K M, Gygi S P, Rist B, Lee H, Aebersold R, Parker K C. J Am Soc Mass Spectrom. 2001;12:1238–1246. - PubMed
Publication types
MeSH terms
Substances
Grants and funding
LinkOut - more resources
Full Text Sources
Other Literature Sources
