. 2002 Feb 19;99(4):2309-14.
doi: 10.1073/pnas.261707398. Epub 2002 Feb 12.

Disruption of primary auditory cortex by synchronous auditory inputs during a critical period

Affiliations

Disruption of primary auditory cortex by synchronous auditory inputs during a critical period

Li I Zhang et al. Proc Natl Acad Sci U S A. .

Abstract

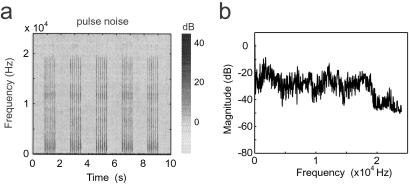
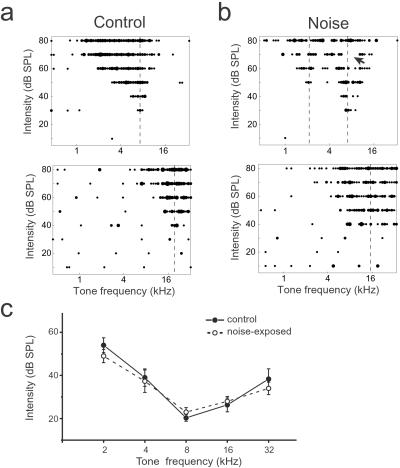
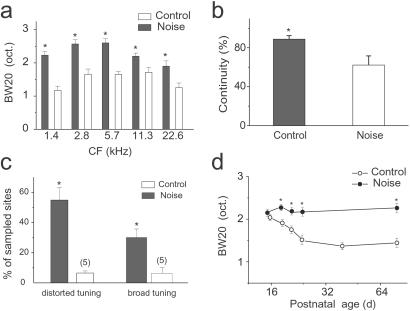
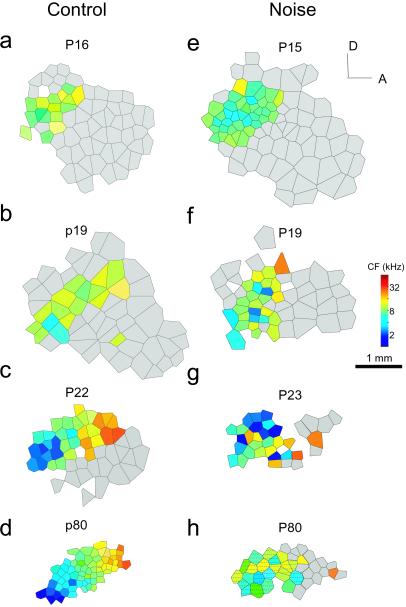
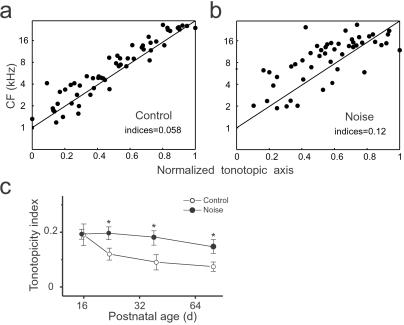
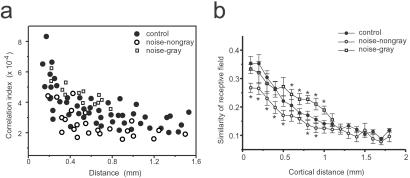
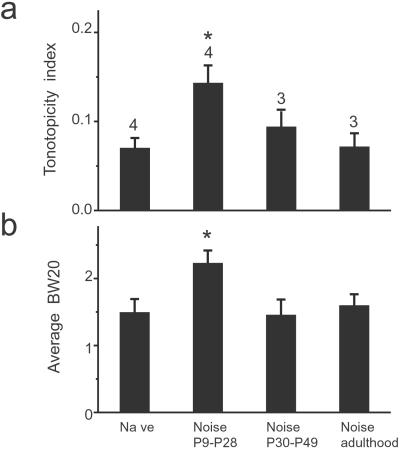
In the primary auditory cortex (AI), the development of tone frequency selectivity and tonotopic organization is influenced by patterns of neural activity. Introduction of synchronous inputs into the auditory pathway achieved by exposing rat pups to pulsed white noise at a moderate intensity during P9-P28 resulted in a disrupted tonotopicity and degraded frequency-response selectivity for neurons in the adult AI. The latter was manifested by broader-than-normal tuning curves, multipeaks, and discontinuous, tone-evoked responses within AI-receptive fields. These effects correlated with the severe impairment of normal, developmental sharpening, and refinement of receptive fields and tonotopicity. In addition, paradoxically weaker than normal temporal correlations between the discharges of nearby AI neurons were recorded in exposed rats. In contrast, noise exposure of rats older than P30 did not cause significant change of auditory cortical maps. Thus, patterned auditory inputs appear to play a crucial role in shaping neuronal processing/decoding circuits in the primary auditory cortex during a critical period.


Figures

Figure 1
Figure 1
Spectrogram (a) and frequency spectrum (b) of the acoustic environment in the presence of noise stimuli. Colors represent relative dB levels for each frequency. Note that the brief pulsed-noise stimuli were applied at a rate of 6 pps, with 1 s spacing between pulse trains. Noise stimuli had a more or less stable energy level over 1–18 kHz.
Figure 2
Figure 2
Representative examples of tonal receptive fields obtained from adult rats reared in control (a) or a pulsed-noise (b) environment. Responses are represented by dots in the response area, with the size of the dot proportional to the number of spikes evoked by tone stimuli. Dotted lines indicate positions of peaks of the receptive fields (CFs). The arrow indicates a typical “blank” domain in which the neuron does not respond to tonal stimuli within the receptive field. (c) Average stimulus intensity threshold at different CF ranges in control or exposed rats. Bin size = 1 octave. Note that there were no significant differences in response thresholds between experimental and control rats (means ± SE; P > 0.2).
Figure 3
Figure 3
Summary of changes of tonal receptive fields. (a) Averaged bandwidths of tuning curves at 20 dB above threshold in control and noise-exposed adult rats for each CF range. Bin size = 1 octave. *, P < 0.02, t test, n > 18 for every group. (b) Average continuity of receptive fields in sampled sites in two groups. Continuity for each sampled site is calculated by the percentage of frequency–intensity combinations within the receptive field area (outlined by the tuning curve) that does not evoke spiking response. Lower continuity resulted from scattered, nonresponsive domains in the frequency–intensity response area (receptive field). *, P < 0.01, n = 118 from noise exposed rats; n = 102 from control rats. (c) Average percentage of sampled sites recorded from four control rats and four noise-exposed rats presenting distorted (multipeaked or discontinuous) or plateau-peaked receptive fields, respectively. *, P < 0.03. (d) Progressive change of tuning-curve bandwidths in two groups of rats during development. BW20s of all sampled sites in the posterior zone in every rat are averaged for each age (three or four rats are examined for each age) in the two groups, respectively. *, P < 0.03, t test.
Figure 4
Figure 4
Progressive development of cortical frequency representation in two different groups of rats. Shown are representative maps from rats at different postnatal ages, demonstrating the progressive changes in tonotopicity in the developing rat auditory cortex in control (Left) or noise-exposure condition (Right). The color of each polygon indicates the CF (in kHz) for neurons recorded at that site. Polygons are Voronoi tessellations, generated so that every point on the cortical surface was assumed to have the characteristics of its closest neighbors. Gray areas label nontuned anterior cortical zones in which neurons respond strongly and preferentially to higher-frequency tonal stimuli. A, anterior; D, dorsal. (Bar = 1 mm; color bar = represented sound frequencies, in kHz.) Areas that have distorted receptive fields are hatched, as shown in h.
Figure 5
Figure 5
(a) Disruption of tonotopicity by noise exposure. (b) Distribution of the cortical representation of different CFs along the tonotopic axis of the auditory cortex. Normalized coordinates (see Materials and Methods) from each rat are plotted together as a function of the defined characteristic frequency. Indices (see Materials and Methods) of precision (imprecision) in tonotopicity are shown in each box (mean ± SE). (c) Progressive development of tonotopicity in control or noise-exposed rats. The tonotopicity indices are averaged for each age group (n = 3 or 4). *, P < 0.05, t test.
Figure 6
Figure 6
Temporal correlations between pairs of sampled recording sites in the absence of sound stimulus. (a) Level of synchronization of spontaneous discharges between cortical neurons with various distances, recorded in adult rats (see Materials and Methods). Empty symbols represent data obtained from noise-exposed rats, with squares for pairs of recordings within the gray regions. The average value of empty circles within a cortical distance of 0.3–1 mm is significantly lower than control, whereas the average value of squares is higher than control (P < 0.05, t test). (b) Average similarity (mean ± SD) of the tonal receptive fields vs. cortical distance. Similarity is the correlation coefficiency of response patterns within response areas for each pair of sampling sites. In the nongray area of AI, the value of similarity within 1 mm of cortical distance is significantly less than that in control animals (*, P < 0.05, t test).
Figure 7
Figure 7
A critical period for the modification of the developing primary auditory cortex. Four different rat groups (naïve rats, P9–P28 noise-exposed rats, P30–P49 noise-exposed rats, and rats exposed during adulthood) are compared. (a) Average tonotopicity indices (means ± SE) obtained from the above four rat groups. The number of rats for each group was labeled for each bar (*, P < 0.02, comparing naïve rats). (b) Average 20-dB bandwidth of receptive fields recorded from the four rat groups.

Similar articles

Cited by

References

    1. Wiesel T N. Nature (London) 1982;299:583–591. - PubMed
    1. Penn A A, Shatz C J. Pediatr Res. 1999;45:447–458. - PubMed
    1. Katz L C, Shatz C J. Science. 1996;274:1133–1138. - PubMed
    1. Blakemore C, Cooper G F. Nature (London) 1970;228:477–478. - PubMed
    1. Sengpiel F, Stawinski P, Bonhoeffer T. Nat Neurosci. 1999;2:727–732. - PubMed