. 2002 Mar;184(5):1359-69.
doi: 10.1128/JB.184.5.1359-1369.2002.

Positive growth rate-dependent regulation of the pdxA, ksgA, and pdxB genes of Escherichia coli K-12

Affiliations

Positive growth rate-dependent regulation of the pdxA, ksgA, and pdxB genes of Escherichia coli K-12

Andrew J Pease et al. J Bacteriol. 2002 Mar.

Abstract

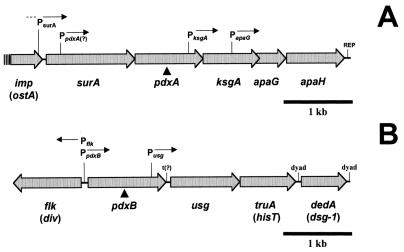
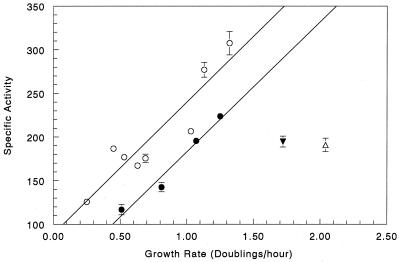
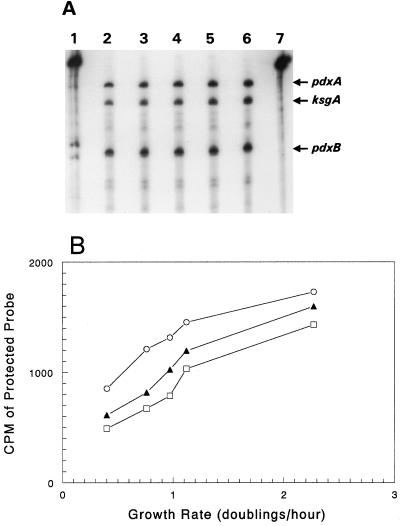
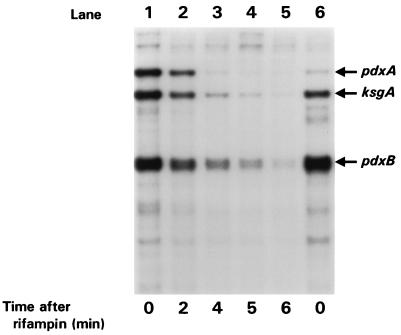
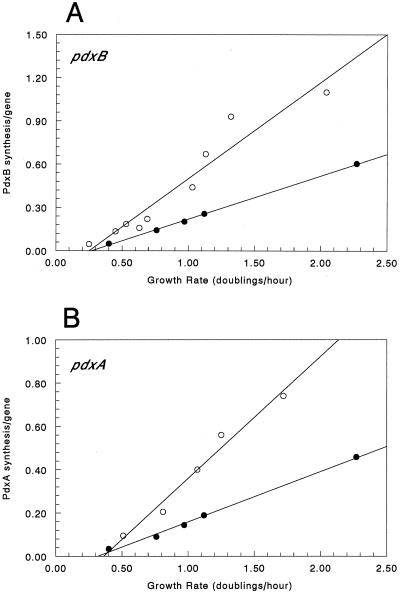
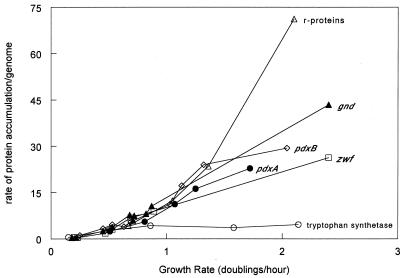
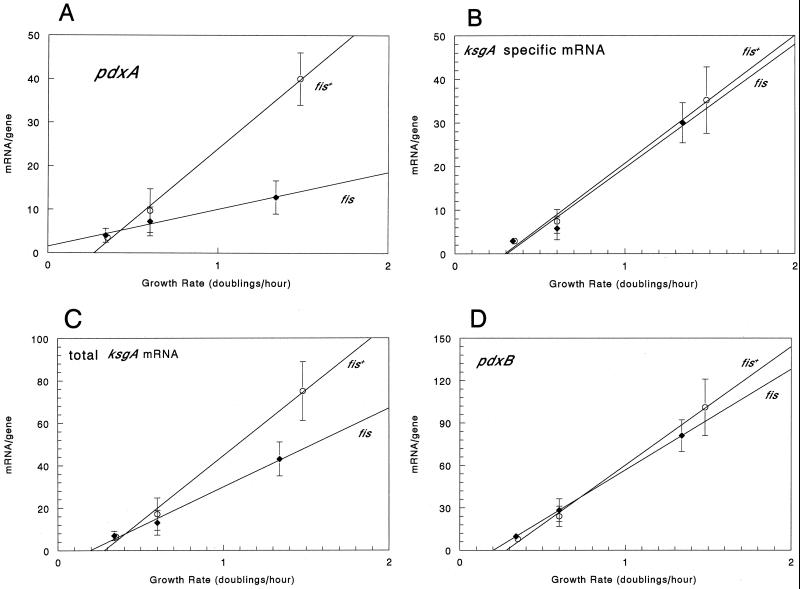
We found that transcription of the pdxA and pdxB genes, which mediate steps in the biosynthesis of the essential coenzyme pyridoxal 5"-phosphate, and the ksgA gene, which encodes an rRNA modification enzyme and is partly cotranscribed with pdxA, is subject to positive growth rate regulation in Escherichia coli K-12. The amounts of the pdxA-ksgA cotranscript and pdxB- and ksgA-specific transcripts and expression from pdxA- and pdxB-lacZ fusions increased as the growth rate increased. The half-lives of ksgA- and pdxB-specific transcripts were not affected by the growth rate, whereas the half-life of the pdxA-ksgA cotranscript was too short to be measured accurately. A method of normalization was applied to determine the amount of mRNA synthesized per gene and the rate of protein accumulation per gene. Normalization removed an apparent anomaly at fast growth rates and demonstrated that positive regulation of pdxB occurs at the level of transcription initiation over the whole range of growth rates tested. RNA polymerase limitation and autoregulation could not account for the positive growth rate regulation of pdxA, pdxB, and ksgA transcription. On the other hand, growth rate regulation of the amount of the pdxA-ksgA cotranscript was abolished by a fis mutation, suggesting a role for the Fis protein. In contrast, the fis mutation had no effect on pdxB- or ksgA-specific transcript amounts. The amounts of the pdxA-ksgA cotranscript and ksgA-specific transcript were repressed in the presence of high intracellular concentrations of guanosine tetraphosphate; however, this effect was independent of relA function for the pdxA-ksgA cotranscript. Amounts of the pdxB-specific transcript remained unchanged during amino acid starvation in wild-type and relA mutant strains.


Figures

FIG. 1.
FIG. 1.
Structures of the pdxA and pdxB superoperons. (A) pdxA superoperon. The site of insertion of the pdxA::mini-MudI lacZ element in strain NU1187 (determined by restriction analysis) (55) is indicated by the solid triangle. The product of the imp gene is involved in organic solvent tolerance (1), and surA encodes a periplasmic peptidyl-prolyl isomerase that assists in the proper folding of outer membrane proteins (42, 57, 66). The likely position of the PsurA promoter is indicated (66). The probe for detection of pdxA-ksgA cotranscripts and ksgA-specific transcripts covers the region between the BglI and PvuII sites (see Materials and Methods) (55). (B) pdxB superoperon. The site of insertion of the pdxB::mini-MudII lacZ translational fusion element in NU1702 (solid triangle) was determined to be in frame by DNA sequencing (59). The probes for detection of pdxB and Pflk cover the region between the HindIII and TaqI sites (see Materials and Methods; 59).
FIG. 2.
FIG. 2.
Growth rate regulation of pdxA- and pdxB-lacZ fusions in strains NU1187 (open symbols) and NU1702 (closed symbols), respectively. Cells were grown exponentially in minimal media containing different carbon sources (circles) or in LB (triangles) (see Materials and Methods). Specific activities of β-galactosidase were determined (see Materials and Methods) and plotted as a function of the growth rate expressed as doublings per hour (μ). The results shown are from at least three independent cultures at each growth rate. The error bars represent the standard error of the mean. Lack of error bars indicates that the standard error of the mean was negligible.
FIG. 3.
FIG. 3.
Amounts of pdxA-ksgA cotranscript and ksgA- and pdxB-specific transcripts in exponentially growing E. coli K-12. (A) Autoradiograph of RNase T2 protection assays. Equal amounts (50 μg) of RNA prepared from cultures of prototrophic strain NU426 grown in MMGly (lane 2), minimal salts-glucose medium (lane 3), enriched minimal salts-glycerol medium (lane 4), EMMG (lane 5), and LB (lane 6) were probed as described in Materials and Methods. Positions of bands corresponding to the pdxA-ksgA cotranscript (labeled pdxA) and the ksgA- and pdxB-specific transcripts are indicated. Lanes 1 and 7 show the undigested pdxA-ksgA and pdxB probes, respectively. The results were from at least three independent cultures at each growth rate. (B) Counts per minute corresponding to the pdxA-ksgA cotranscript (filled triangles), the ksgA-specific transcript (open rectangles), and the pdxB-specific transcript (open circles) were determined from gels such as the one in panel A by direct counting and plotted as a function of the growth rate.
FIG. 4.
FIG. 4.
Determination of the t1/2s of the pdxA-ksgA cotranscript and ksgA- and pdxB-specific transcripts of E. coli K-12 growing exponentially in LB-Glc. Equal amounts of RNA isolated from NU426 growing in LB-Glc before (lane 1) and at various times after (lanes 2 to 5) rifampin addition were probed as described in Materials and Methods. Positions of bands corresponding to the pdxA-ksgA cotranscript and the ksgA- and pdxB-specific transcripts are indicated. Analogous experiments were performed for NU426 grown at additional growth rates (data not shown; Results). Lane 6, amounts of the same transcripts from NU426 subjected to starvation for amino acids (Results). The results shown are from at least three independent cultures at each growth rate.
FIG. 5.
FIG. 5.
pdxA and pdxB gene expression normalized per gene. The data from Fig. 2 was expressed as rates of protein accumulation per gene (open circles) (see Materials and Methods). The data from Fig. 3B was expressed as the amount of mRNA per gene (closed circles) (see Materials and Methods). Panels: A, pdxB gene expression normalized per gene; B, pdxA gene expression normalized per gene.
FIG. 6.
FIG. 6.
Rate of accumulation of several proteins normalized per genome (see Materials and Methods) plotted as a function of the growth rate (μ) in doublings per hour. Symbols: PdxB, open triangles; r-proteins, open triangles; tryptophan synthetase (TrpAB), open circles; PdxA, filled circles; Gnd, filled triangles; Zwf, open rectangles.
FIG. 7.
FIG. 7.
Effect of a fis mutation on the growth rate regulation of the amount of the pdxA-ksgA cotranscript, the amount of the ksgA- and pdxB-specific transcripts, and the total amount of the ksgA transcript. Total RNA isolated from NU426 (open symbols) or TX3333 (NU426 fis) (closed symbols) growing exponentially in minimal salts-acetate medium, MMGly, or EMMG was probed as described in Materials and Methods. Counts per minute corresponding to individual bands were expressed as the amount of mRNA per gene (see Materials and Methods), and the average amount of mRNA per gene for each transcript was calculated from three and four independent experiments for NU426 and TX3333, respectively, and plotted against the growth rate. Standard deviations of the mean are shown. Panels: A, pdxA-ksgA cotranscript; B, ksgA-specific transcript; C, total ksgA transcript (sum of panels A and B); D, pdxB-specific transcript.

References

    1. Aono, R., T. Negishi, and H. Nakajima. 1994. Cloning of organic solvent tolerance gene ostA that determines n-hexane tolerance in Escherichia coli. Appl. Environ. Microbiol. 60:4624-4626. - PMC - PubMed
    1. Arps, P. J., and M. E. Winkler. 1987. Structural analysis of the Escherichia coli K-12 hisT operon by using a kanamycin resistance cassette. J. Bacteriol. 169:1061-1070. - PMC - PubMed
    1. Arps, P. J., and M. E. Winkler. 1987. An unusual genetic link between vitamin B6 biosynthesis and tRNA pseudouridine modification in Escherichia coli K-12. J. Bacteriol. 169:1071-1079. - PMC - PubMed
    1. Ausubel, F. M., R. Brent, R. E. Kingston, D. D. Moore, J. G. Seidman, J. A. Smaith, and K. Struhl. 1993. Current protocols in molecular biology. Wiley-Interscience, New York, N.Y.
    1. Ball, C. A., R. Osuna, K. C. Ferguson, and R. C. Johnson. 1992. Dramatic changes in Fis levels upon nutrient upshift in Escherichia coli. J. Bacteriol. 174:8043-8056. - PMC - PubMed

Publication types

MeSH terms

LinkOut - more resources