

Ethnic-difference markers for use in mapping by admixture linkage disequilibrium
- PMID: 11845411
- PMCID: PMC384950
- DOI: 10.1086/339368
Ethnic-difference markers for use in mapping by admixture linkage disequilibrium
Abstract
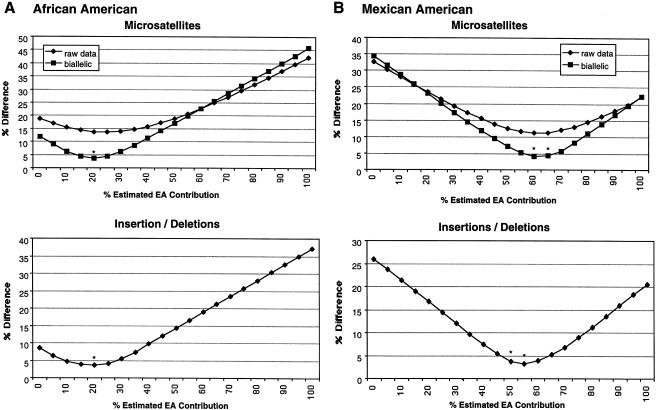
Mapping by admixture linkage disequilibrium (MALD) is a potentially powerful technique for the mapping of complex genetic diseases. The practical requirements of this method include (a) a set of markers spanning the genome that have large allele-frequency differences between the parental ethnicities contributing to the admixed population and (b) an understanding of the extent of admixture in the study population. To this end, a DNA-pooling technique was used to screen microsatellite and diallelic insertion/deletion markers for allele-frequency differences between putative representatives of the parental populations of the admixed Mexican American (MA) and African American (AA) populations. Markers with promising pooled differences were then confirmed by individual genotyping in both the parental and admixed populations. For the MA population, screening of >600 markers identified 151 ethnic-difference markers (EDMs) with delta>0.30 (where delta is the absolute value of each allele-frequency difference between two populations, summed over all marker alleles and divided by two) that are likely to be useful for MALD analysis. For the AA population, analysis of >400 markers identified 97 EDMs. In addition, individual genotyping of these markers in Pima Amerindians, Yavapai Amerindians, European American (EA) individuals, Africans from Zimbabwe, MA individuals, and AA individuals, as well as comparison to the CEPH genotyping set, suggests that the differences between subpopulations of an ethnicity are small for many markers with large interethnic differences. Estimates of admixture that are based on individual genotyping of these markers are consistent with a 60% EA:40% Amerindian contribution to MA populations and with a 20% EA:80% African contribution to AA populations. Taken together, these data suggest that EDMs with large interpopulation and small intrapopulation differences can be readily identified for MALD studies in both AA and MA populations.
Figures
References
Electronic-Database Information
-
- Center for Medical Genetics, Marshfield Medical Research Foundation, http://research.marshfieldclinic.org/genetics/ (for screening set 8A, unlabeled SIDPs, and genetic maps)
-
- Ethnic Difference Marker (EDM) Allele Frequencies, http://roweprogram.ucdavis.edu/Ethnic_Difference_Markers.pdf (for allele frequencies of markers)
-
- Fondation Jean Dausset CEPH, http://www.cephb.fr/cephdb/ (for genotyping data sets)
-
- UCSC Human Genome Project Working Draft, http://genome.ucsc.edu/ (for megabase positions of EDMs)
References
-
- Bali D, Gourley IS, Kostyu DD, Goel N, Bruce I, Bell A, Walker DJ, Tran K, Zhu DK, Costello TJ, Amos CI, Seldin MF (1999) Genetic analysis of multiplex rheumatoid arthritis families. Genes Immun 1:28–36 - PubMed
-
- Bowcock AM, Ruiz-Linares A, Tomfohrde J, Minch E, Kidd JR, Cavalli-Sforza LL (1994) High resolution of human evolutionary trees with polymorphic microsatellites. Nature 368:455–457 - PubMed
-
- Briscoe D, Stephens JC, O’Brien SJ (1994) Linkage disequilibrium in admixed populations: applications in gene mapping. J Hered 85:59–63 - PubMed
Publication types
MeSH terms
Grants and funding
LinkOut - more resources
Full Text Sources
Other Literature Sources
Medical
