. 2002 Feb;23(2):255-66.

Temporal lobe morphology in normal aging and traumatic brain injury

Affiliations

Temporal lobe morphology in normal aging and traumatic brain injury

Erin D Bigler et al. AJNR Am J Neuroradiol. 2002 Feb.

Erratum in

  • AJNR Am J Neuroradiol 2002 Apr;23(4):742. Andersob Carol V [corrected to Anderson Carol V]

Abstract

Background and purpose: Little is known regarding changes in the temporal lobe associated with traumatic brain injury (TBI) in early-to-mid adulthood. We report on two quantitative MR studies: study 1 addressed age-related changes of the temporal lobe in subjects aged 16-72 years; information obtained in this study provided a normative database for comparison with findings in 118 patients with TBI who were included in study 2. We expected stable morphology in healthy subjects and trauma-related atrophy in patients with TBI.

Methods: MR multispectral tissue segmentation was used to calculate bilateral temporal lobe gyrus and sulcus, sylvian fissure CSF, hippocampus, and temporal horn volumes and to measure the white matter (WM) temporal stem.

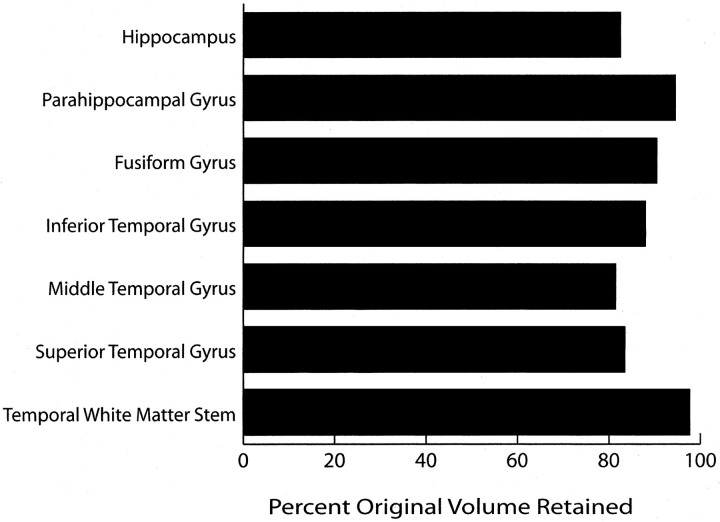
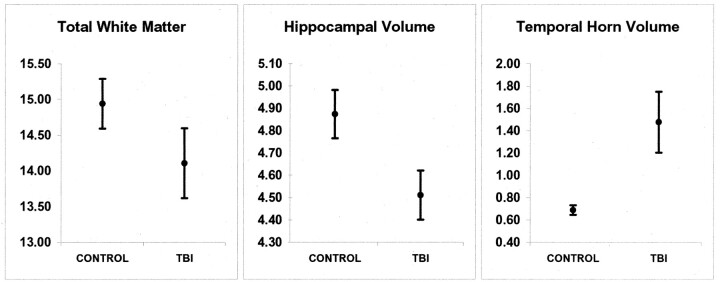
Results: With normal aging, gyral volume remained stable, decreasing approximately 0.26% per year (total, approximately 11%). Sulcal CSF volume doubled. Hippocampal volume decreased (minimally, significantly); temporal horn volume increased (not significantly) and was minimally related to hippocampal volume. WM measurements were constant. Trauma changed morphology; WM measures decreased. Gyral volumes were not different between the groups. In TBI, CSF volume increased significantly, was most related to reduced WM measurements, and was relatively independent of gyral volume. Temporal horn dilatation was related more to WM atrophy than to hippocampal atrophy. In TBI, subarachnoid sulcal and temporal horn CSF volumes were most related to WM atrophy, which was relatively independent of gyral volume; gyral and hippocampal volumes and WM measures were related to memory performance.

Conclusion: Age-related changes cause minimal temporal lobe gyral, hippocampal, temporal horn, and WM atrophy. Only subarachnoid sulcal CSF volume changed robustly. Trauma produced disproportionate WM loss associated with increased temporal horn and sulcal CSF volumes; it caused substantial hippocampal atrophy, which was related to memory impairment. Gyral volume did not decrease, although it was related to memory performance.


Figures

F<sc>ig</sc> 1.
Fig 1.
Images used in volume determination. A, Coronal T2-weighted MR image. B, Coronal intermediate-weighted MR image. C, Segmentation image from A and B. D, Feature space showing separation of CSF (blue), white matter (khaki), and gray matter (tan). E, Close-up segmented image of the right temporal lobe depicts the hippocampus and five temporal gyri. F, The red line indicates the length of WM from the base of the superior temporal sulcus to the base of rhinal sulcus and defines the temporal stem measurement. The linear distance (in centimeters) provided the basis for this measure, summed across all sections.
F<sc>ig</sc> 2.
Fig 2.
Bar graph shows hippocampal and temporal lobe gyral volumes, along with WM temporal stem measurements grouped by subjects’ ages (in years). The P values are based on analysis of variance comparisons across the decades in which significant changes may have occurred. Note the significant age effects on hippocampal volume and several gyral volumes, although considerable variability exists, as represented by the SD bars. All measures are in cubic centimeters3, with the exception of the temporal stem linear measure, which is in millimeters.
F<sc>ig</sc> 3.
Fig 3.
Bar graph shows sulcal CSF and temporal horn volumes grouped by subjects’ ages (in years). The P values indicate whether a significant change in volume by decade was present. The number on the bars are the SDs. Note the consistent and highly significant increases in CSF volumes (except for that of the left rhinal sulcus) with aging.
F<sc>ig</sc> 4.
Fig 4.
Bar graph shows the percentage of original volume retained in each temporal lobe structure, as determined by comparing the value in 16–25-year-old subjects with that in 56–72-year old subjects. Most structures, particularly the temporal WM stem, retain a large percentage of their original volume over time.
F<sc>ig</sc> 5.
Fig 5.
Scatterplots show total temporal gyral and sulcal volumes, hippocampal volumes, and temporal stem measurements, fitted with linear and quadratic functions. Note the greater variability in sulcal volume compared with the parenchymal measures. At statistical analysis, degrees of freedom for regression and residuals, respectively, were 2 and 251 for the linear function and 1 and 252 for the quadratic function. For each structure, values with the functions were as follows: total gyral volume, quadratic F = 4.35 and P ≤ .014, linear F = 7.97 and P ≤ .005; total sulcal volume, quadratic F = 14.09 and P ≤ .00001, linear F = 24.06 and P ≤ .00001; total hippocampal volume, quadratic F = 3.65 and P ≤ .03, linear F = 7.14 and P ≤ .008; and total WM, quadratic F = 1.2 and P ≤ .29, linear F = 1.41 and P ≤ .24. In each case, head size (total intracranial volume) and sex were used as covariates.
F<sc>ig</sc> 6.
Fig 6.
Bar graph shows the mean for volumes in the comparison of healthy control subjects and patients with TBI. In each case, TBI resulted in significant atrophy (P ≤ .01). The number on the bars are the SDs.
F<sc>ig</sc> 7.
Fig 7.
Graphs show the total WM measure in the temporal stem, hippocampal volume, and temporal horn volume. In each case, TBI resulted in significant atrophy (P ≤ .01). The bars indicate the SDs.

References

    1. Giedd JN, Snell JW, Lange N, et al. Quantitative magnetic resonance imaging of human brain development: ages 4–18. Cereb Cortex 1996;6:551–560 - PubMed
    1. Blatter DD, Bigler ED, Gale SC, et al. Quantitative volumetric analysis of brain MR: normative database spanning five decades of life. AJNR Am J Neuroradiol 1995;16:241–251 - PMC - PubMed
    1. Harris GJ, Barta PE, Peng LW, et al. MR volume segmentation of gray matter and white matter using manual thresholding: dependence on image brightness. AJNR Am J Neuroradiol 1994;15:225–230 - PMC - PubMed
    1. Paus T, Zijdenbos A, Worsley K, et al. Structural maturation of neural pathways in children and adolescents: in vivo study. Science 1999;283:1908–1912 - PubMed
    1. Thompson PM, Moussai J, Zohoori S, et al. Cortical variability and asymmetry in normal aging and Alzheimer’s disease. Cereb Cortex 1998;8:492–509 - PubMed

Publication types

LinkOut - more resources