. 2002 Feb 15;21(4):525-35.
doi: 10.1093/emboj/21.4.525.

The PreS2 activator MHBs(t) of hepatitis B virus activates c-raf-1/Erk2 signaling in transgenic mice

Affiliations

The PreS2 activator MHBs(t) of hepatitis B virus activates c-raf-1/Erk2 signaling in transgenic mice

Eberhard Hildt et al. EMBO J. .

Abstract

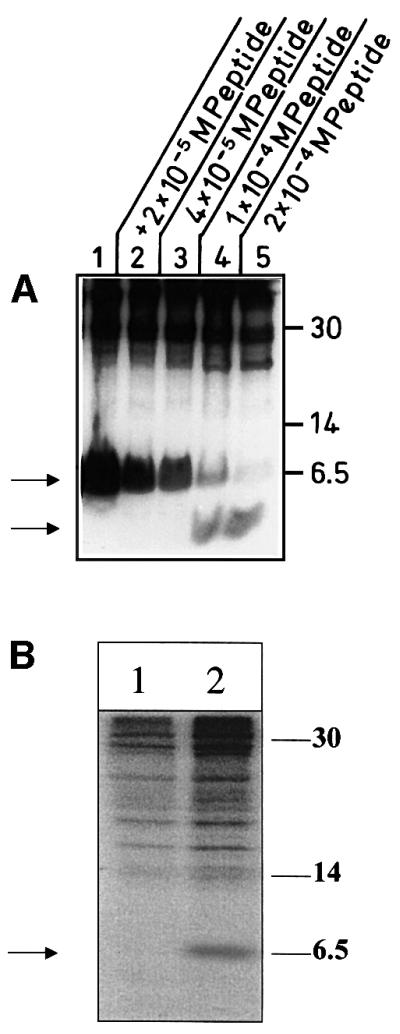
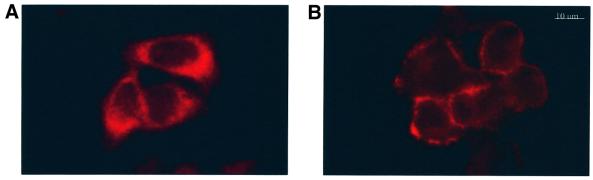
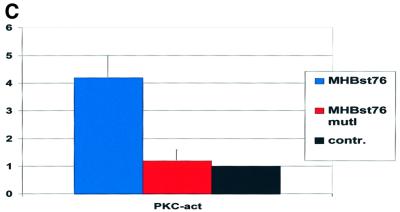
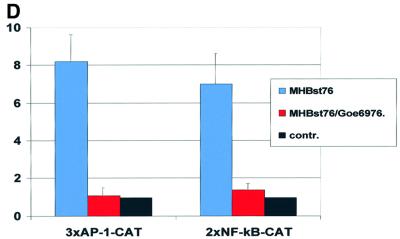
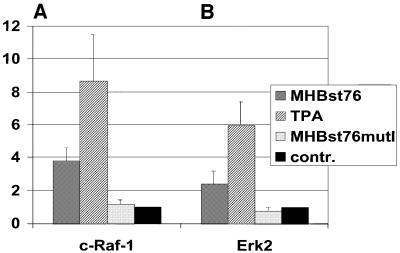
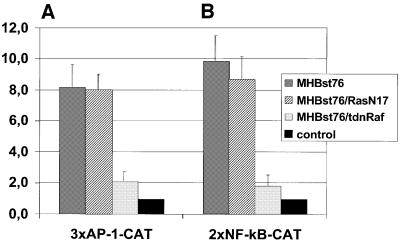
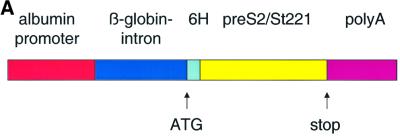
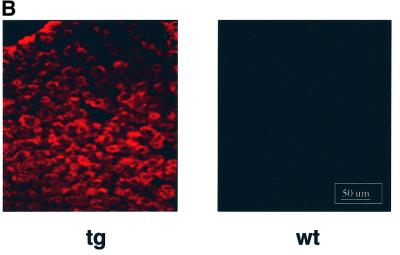
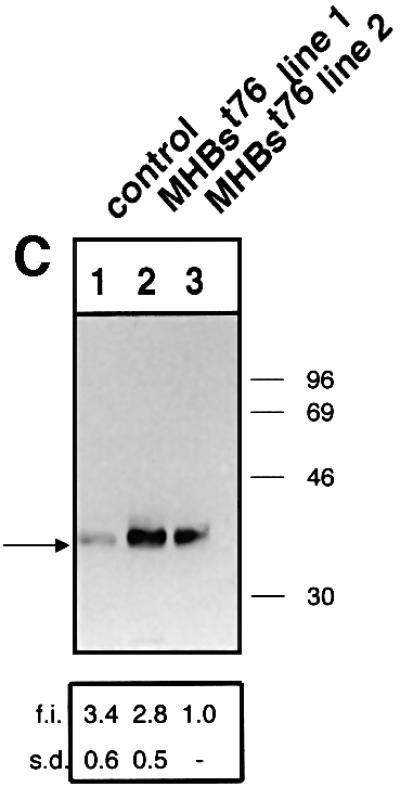
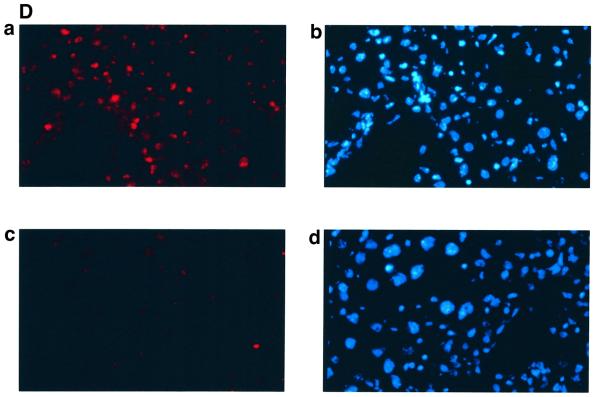
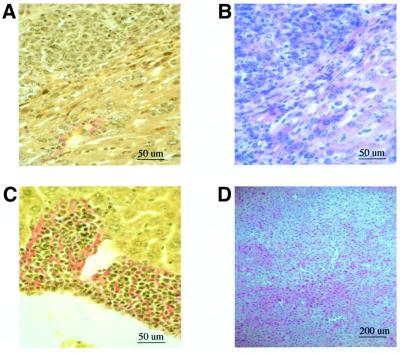
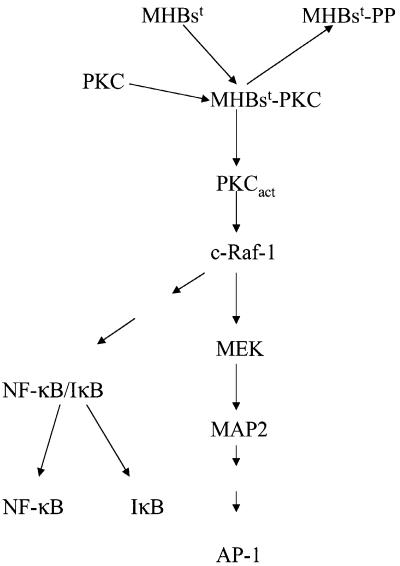
The large hepatitis B virus (HBV) surface protein (LHBs) and C-terminally truncated middle size surface proteins (MHBs(t)) form the family of the PreS2 activator proteins of HBV. Their transcriptional activator function is based on the cytoplasmic orientation of the PreS2 domain. MHBs(t) activators are paradigmatic for this class of activators. Here we report that MHBs(t) is protein kinase C (PKC)-dependently phosphorylated at Ser28. The integrity of the phosphorylation site is essential for the activator function. MHBs(t) triggers PKC-dependent activation of c-Raf-1/Erk2 signaling that is a prerequisite for MHBs(t)-dependent activation of AP-1 and NF-kappaB. To analyze the pathophysiological relevance of these data in vivo, transgenic mice were established that produce the PreS2 activator MHBs(t) specifically in the liver. In these mice, a permanent PreS2-dependent specific activation of c-Raf-1/Erk2 signaling was observed, resulting in an increased hepatocyte proliferation rate. In transgenics older than 15 months, an increased incidence of liver tumors occurs. These data suggest that PreS2 activators LHBs and MHBs(t) exert a tumor promoter-like function by activation of key enzymes of proliferation control.


Figures

None
Fig. 1. MHBst is a phosphoprotein. (A) Highly purified His6-MHBst76 was derived from Sf9 cells. A 40 µg aliquot was subjected to isoelectric focusing under denaturing conditions using immobiline gel strips covering a range of pH 6–10. The separation in the second dimension was performed using a 15% Laemmli gel. The gel was silver stained. (B) Western blot analysis of highly purified His6-MHBst76 derived from Sf9 cells after two-dimensional separation as described in (A) using a PreS2-specific antiserum (F124). (C) Western blot analysis of highly purifed His6- MHBst76 derived from Sf9 cells using a PreS2-specific antiserum (F124). The sample were subjected to acid phosphatase treatment prior to two-dimensional separation. (D) Autoradiograph of Ni-NTA-precipitated and SDS–PAGE-separated His6-MHBst76 (lane 2), His6-MHBst63 (lane 4), His6-MHBs (lane 7), His6-MHBst76mutI (lane 3), His6-MHBst76mutII (lane 6), His6-MHBst63mutI (lane 5) and His6-MHBst63mutII (lane 8) derived from cellular lysates of [32P]orthophosphate-labeled, transfected HepG2 cells. Cells transfected with the cloning vector served as negative control (lane 1). The autoradiograph shows that in contrast to full-length MHBs, the functional MHBst activators are phosphoproteins.
None
Fig. 2. MHBst is phosphorylated between amino acids 27 and 31. (A) Left: autoradiograph of eubacteria-derived MHBst76, incubated with cytoplasm derived from CCL13 cells and [γ-32P]ATP (lane 1); as negative control, MHBst76 was incubated in the absence of lysate, which was replaced by an equal volume of homogenization buffer (lane 2). The molecular weight marker is given on the right. Right: autoradiograph of eubacteria-derived MHBst76, incubated with cytoplasm derived from CCL13 cells and [γ-32P]ATP (lane 3); as negative control, MHBst76 was replaced by His6-grb2 (lane 4). (B) Autoradiograph of in vitro phosphorylated MHBst fragments (MHBst1-63, MHBst1-52, MHBst11–76, MHBst23–76 and MHBst1-52*; here the amphiphatic α-helix between amino acids 41 and 52 was replaced by a β-sheet conformation) isolated from the eubacterial expression system. The experiments were performed in duplicate. In the case of MHBst11–76, only one-fifth of the amount of MHBst employed in the other reactions was used. (C) Autoradiograph of in vivo phosphorylated and Ni-NTA-agarose-precipitated MHBst-specific proteins: lane 1, MHBst63 mutIa; lane 2, MHBst63mutIb; lane 3, MHBst63mutIc; lane 4, MHBst63mutId; lane 5, wild-type MHBst63; and lane 6, control transfected cells. (D) CAT assay after co-transfection of HepG2 cells with reporter plasmid p3xAP-1-CAT and expression plasmid pKSVMHBst76, encoding the wild-type, or plasmids pKSVMHBst76mutI, pKSVMHBst76mutII, pKSVMHBst76mutID28, or cloning vector pKSV10 as negative control. Fold inductions are mean values from three independent transfection experiments, calculated as the ratio of the induced values to the vector control. The standard deviation is shown in the diagram.
None
Fig. 3. Functionality of PKC is essential for phosphorylation of MHBst. (A) Competitive inhibition of in vitro phosphorylation of MHBst using increasing concentrations (2 × 10–5 M, lane 2, to 2 × 10–4 M, lane 5) of a PKC-specific peptide. In lanes 4 and 5, the lower band represents the phosphorylated peptide. Lane 1 represents the phosphorylation of MHBst63 in the absence of the peptide. (BIn vivo labeling using [32P]orthophosphate of HepG2 cells producing His6-MHBst76 (lanes 1 and 2) grown in the absence (lane 2) or presence of the PKC inhibitor Goe6976 (lane 1). His6-MHBst76 was enriched by Ni-NTA precipitation.
None
Fig. 4. PKC is activated in MHBst-producing cells: inhibition abolishes MHBst-dependent activation of AP-1 and NF-κB. (A and B) Immunofluorescence of HepG2 cells stably transfected with the expression vector pCMVMHBst76 (A). Untransfected cells served as the negative control (B). For detection, a mixture of PKCα- and PKCβ-specific antisera was used. Micrographs were taken at a 400× magnification. (C) CCL13 cells were transfected with the MHBst76 expression plasmid pKSVMHBst76 or with pKSVMHBst76mutI. Transfection with pKSV10 served as the control. The activation was determined by the ratio of membrane-bound to cytosolic PKC activity. In the case of control-transfected cells, this ratio was set arbitrarily as 1. The given factors are mean values of four independent experiments. The standard deviation is shown in the diagram. (D) Transient transfection of HepG2 cells with MHBst76 expression plasmid pCMVMHBst76 and the reporter constructs p3xAP-1-CAT or p2xNF-κB-CAT. Transfection with pCDNA.3 served as the negative control. Classic PKC isoforms were inhibited by the presence of 10 nM Goe6976. Cells were harvested 40 h after transfection. CAT activity was determined as described in Materials and methods. Fold inductions are mean values from four independent transfection experiments, calculated as the ratio of the induced values to the vector control. The standard deviation is shown in the diagram.
None
Fig. 5. MHBst induces activation of c-Raf-1and Erk2. (A and B) The activity of c-Raf-1 and Erk2 was determined by immunocomplex assays using recombinant MEK or basic myeloglycoprotein (MBP), respectively, as substrates. HepG2 cells were transfected with pCMVMHBst76 or with the phosphorylation-deficient mutant pCMVMHBst76mutI. TPA stimulation was used as a positive control. The activity of c-Raf-1 or Erk2 in control-transfected cells was set arbitrarily as 1. The given factors are mean values of three independent experiments. The standard deviation is shown in the diagram.
None
Fig. 6. Functionality of c-Raf-1 kinase is a prerequisite for MHBst-dependent activation of AP-1 and NF-κB. HepG2 cells were transiently transfected with the MHBst76 expression plasmid pCMVMHBst76, the reporter constructs p3xAP-1-CAT or p2xNF-κB-CAT and a transdominant-negative mutant of Ras (RasN17) or c-Raf-1 (HCR13.1) or with an equal amount of the vector pMNC to equalize the total amount of DNA. Transfection with the cloning vector pCDNA.3 served as negative control. At 36 h after transfection, CAT activity was determined. Fold inductions are mean values from three independent transfection experiments, calculated as the ratio of the induced values to the vector control. The standard deviation is shown in the diagram.
None
Fig. 7. Liver-specific expression of the transgene encoding MHBst76. (A) Schematic structure of the transgene encoding MHBst76. To direct the expression to the liver, the albumin promoter that was taken from the plasmid pAlb-PSX (Chisari et al., 1985) was used. To increase the expression level, the β-globin intron, derived from plasmid pSWbglob (Werner et al., 1993), was inserted. The HBV-specific fragment nt3174–3221 was fused to the sequence coding for an N-terminal His6 tag. The poly(A) site was taken from SV40, subcloned in plasmid pAK2 (Lauer et al., 1992). The HBV-specific fragment nt3174–3221 codes for MHBst76. (B) Immunofluorescence microscopy of liver sections derived from 5-month-old female MHBst76-producing mice (line 2) (tg). Sections derived from sex-matched wild-type littermates served as control (wt). The PreS2-specific mAb F124 (Neurath et al., 1987) was used for detection of MHBst76. The staining was performed using a Cy3-conjugated donkey-derived secondary antibody. The micrographs were taken at a 400× magnification. (C) I: western blot analysis of the eluates from Ni-loaded Hitrap chelating columns. The columns were loaded with lysates derived from the liver or kidney of MHBst76-producing transgenic mice or their respective littermates (5-month-old, female mice, line I). Elution was performed by a gradient of increasing imidazole concentration. The PreS2-specific mAb HBV 25-19 (Mimms et al., 1990) was used for detection of MHBst76l. II: western blot analysis, using a phosphoserine-specific antiserum (Sigma), of the eluates from Ni-loaded Hitrap chelating columns. The columns were loaded with lysates derived from the liver of wild-type mice (lanes 1 and 3) or MHBst76-producing transgenic mice (5-month-old, female mice, line I, lane 2; line II, lane 4). The western blot shows that the mouse-derived MHBst76 is a phosphoprotein.
None
Fig. 8. MHBst76 triggers in vivo specific activation of the c-Raf-1/Erk2 signal transduction pathway resulting in an increased proliferation rate of the hepatocytes. (A) Immunocomplex assay of c-Raf-1 activity in liver-derived lysates of MHBst76-producing mice (lines 1 and 2), of LHBs-producing transgenic mice, or of the corresponding littermates as negative control. In the case of the lysates derived from LHBs- or MHBst76-producing mice, the autoradiograph shows a significant activation of c-Raf-1 as compared with the control. The activation factors (f.a.) are mean values of three independent experiments. Both f.a. and standard deviation (s.d.) are shown at the bottom of the figure. (B) Immunocomplex assay of Erk2 activity in liver-derived lysates of MHBst76-producing mice (lines 1 and 2), of LHBs-producing transgenic mice or of the corresponding littermates as negative control. In the case of the lysates derived from LHBs- or MHBst76-producing mice, the autoradiograph shows a significant activation of Erk2 as compared with the control. The f.a. are mean values of three independent experiments. Both f.a. and s.d. are shown at the bottom of the figure. (C) Western blot analysis of lysates derived from the liver of the two lines of MHBst76-producing transgenic mice (lanes 2 and 3) and of the corresponding littermates (lane 1) using a PCNA-specific antiserum. The western blot shows that in the case of the lysates derived from the MHBst76-producing transgenics, an elevated amount of PCNA as compared with the control was detectable. The induction factors (f.i.) are mean values of three independent experiments. Both f.i. and s.d. are shown at the bottom of the figure. (D) Immunofluorescence microscopy of liver cryosections derived from a male 6-month-old MHBst76-producing mouse (a and b). A sex- and age-matched wild-type littermate served as control. For detection of PCNA (a and c), a PCNA-specific monoclonal antibody (Santa Cruz) was used and was visualized using a Cy3-conjugated anti-mouse secondary antiserum (Dianova). The nuclei were visualized by DAPI staining (b and d).
None
Fig. 9. Increased incidence of liver tumors in transgenics producing the activator MHBst76. van Gieson-stained (A and C) and HE-stained (B and D) sections of paraffin-embedded liver tissue derived from 15-month-old MHBst76-producing mice. These sections encompass healthy tissue and tumor tissue. In (C), infiltration in surrounding liver tissue can be observed in the case of a MHBst76 mouse with a primary liver tumor. These photographs were taken at 400× magnification. No significant histological change can be observed in the case of (D), which shows HE-stained liver tissue from a 4-month-old MHBst76-producing mouse at 100× magnification.
None
Fig. 10. Schematic representation of the interference of the PreS2-activators with intracellular signal transduction pathways.

Similar articles

Cited by

References

    1. Beasley R.P., Lin,C.C., Hwang,L.Y. and Chien,C.S. (1981) Hepatocellular carcinoma and hepatitis B virus. A prospective study of 22,707 men in Taiwan. Lancet, 2, 1129–1133. - PubMed
    1. Benn J. and Schneider,R.J. (1994) Hepatitis B virus HBx protein activates Ras-GTP complex formation and establishes a Ras, Raf, MAP kinase signaling cascade. Proc. Natl Acad. Sci. USA, 91, 10350–10354. - PMC - PubMed
    1. Bruss V., Lu,R., Thomssen,R. and Gerlich,W. (1994) Post translational alterations in the transmembrane topology of the hepatitis B virus large envelope protein. EMBO J., 13, 2273–2279. - PMC - PubMed
    1. Caroll M. and May,W.S. (1994) Protein kinase C-mediated serine phosphorylation directly activates raf-1 in murine hematopoietic cells. J. Biol. Chem., 269, 1249–1256. - PubMed
    1. Chisari F.V., Pinkert,C.A., Milich,D.R., Filippi,P., McLachlan,A., Palmiter,R.D. and Brinster,R.L. (1985) A transgenic mouse model of the chronic hepatitis B surface antigen carrier state. Science, 230, 1157–1160. - PubMed

Publication types

MeSH terms

Substances