. 2002 Feb 15;21(4):622-30.
doi: 10.1093/emboj/21.4.622.

Ca(2+) dynamics in the lumen of the endoplasmic reticulum in sensory neurons: direct visualization of Ca(2+)-induced Ca(2+) release triggered by physiological Ca(2+) entry

Affiliations

Ca(2+) dynamics in the lumen of the endoplasmic reticulum in sensory neurons: direct visualization of Ca(2+)-induced Ca(2+) release triggered by physiological Ca(2+) entry

N Solovyova et al. EMBO J. .

Abstract

In cultured rat dorsal root ganglia neurons, we measured membrane currents, using the patch-clamp whole-cell technique, and the concentrations of free Ca(2+) in the cytosol ([Ca(2+)](i)) and in the lumen of the endoplasmic reticulum (ER) ([Ca(2+)](L)), using high- (Fluo-3) and low- (Mag-Fura-2) affinity Ca(2+)-sensitive fluorescent probes and video imaging. Resting [Ca(2+)](L) concentration varied between 60 and 270 microM. Activation of ryanodine receptors by caffeine triggered a rapid fall in [Ca(2+)](L) levels, which amounted to only 40--50% of the resting [Ca(2+)](L) value. Using electrophysiological depolarization, we directly demonstrate the process of Ca(2+)-induced Ca(2+) release triggered by Ca(2+) entry through voltage-gated Ca(2+) channels. The amplitude of Ca(2+) release from the ER lumen was linearly dependent on I(Ca).


Figures
None
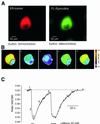
Fig. 1. Imaging of the ER in individual DRG neurons. (A) Images of the same DRG neuron stained with ER-Tracker (100 nM, 10 min, left panel) and BODIPY FL-X fluorescent ryanodine (1 µM, 5 min). The fluorescence was excited at 357 (ER-Tracker) and 488 nm (FL-ryanodine) and emitted light was collected at 530 ± 15 nm. (B) Imaging of the Ca2+ concentration within the ER lumen by Mag-Fura-2. The selected ratio (340/380 nm) images were taken from the DRG neuron after the cytoplasmic portion of the dye was washed out via intracellular dialysis with normal intrapipette solution. The images were taken before, during and after the cell was exposed to 20 mM caffeine. The exact times when images were taken are indicated in (C). (C) Caffeine-induced changes in the Mag-Fura-2 ratio taken from the cell shown in (B). Fluorescence was collected from the region of interest (ROI) shown on the first image. Caffeine was applied as indicated on the graph.
None
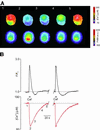
Fig. 2. Caffeine-induced [Ca2+]L decrease is regulated by the pre-stimulated level of [Ca2+]L. (A) Two examples of caffeine (20 mM)-induced [Ca2+]L responses obtained from different DRG neurons with different resting [Ca2+]L. Upper traces show calibrated [Ca2+]L changes whereas their first derivatives are shown at the bottom. The drug was administered for 5 s as indicated on the graph. Note the difference in amplitudes and maximal rate of [Ca2+]L decrease. (B) Amplitudes (Δ[Ca2+]L, left panel) and maximal rate of fall of [Ca2+]L (Δ[Ca2+]L/Δt, right panel) of [Ca2+]L transients induced by 5 s of 20 mM caffeine applications plotted as a function of resting intraluminal Ca2+ concentration. Every point represents an individual cell. The red line shows a linear regression fit.
None
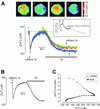
Fig. 3. Simultaneous visualization of [Ca2+]i and [Ca2+]L dynamics in DRG neurons. (A) Selected images of the Mag-Fura-2 ratio (340/380 nm, upper panel) taken simultaneously with images of Fluo-3 fluorescent intensity (488 nm) from the DRG neuron exposed to 20 mM caffeine. The ROI for further measurements is drawn over the first image. (B) Calibrated recordings of [Ca2+]L and normalized Fluo-3 fluorescent intensity (reflecting changes in [Ca2+]i) taken from the cell shown in (A). Caffeine was applied as indicated on the graph; the positions of the images shown in (A) are shown near the [Ca2+]L trace.
None
Fig. 4. Ca2+ release, Ca2+ reuptake and Ca2+ leak from the ER store: dependence on [Ca2+]L. (A) [Ca2+]L was measured separately from three ROIs from the neuron, images of which and the ROI positions (distinguished by colours) are shown on the top. The lower panel shows [Ca2+]L traces, colour coded according to the respective ROI. Initial application of caffeine triggered rapid Ca2+ release followed by [Ca2+]L reuptake after removal of agonist. When [Ca2+]L recovered to the pre-stimulated level, 5 µM thapsigargin was added to block the SERCA pumps. This resulted in a slow decrease in [Ca2+]L due to an unopposed leakage from the store. Note that caffeine and TG reduced [Ca2+]L to the same extent. The inset shows that application of ionomycin in Ca2+-free, EGTA-containing solution following TG led to a complete depletion of the store. (B) [Ca2+]L trace taken from another DRG neuron employing the protocol described in (A). (C) The relationship between Ca2+ transport rates and [Ca2+]L derived from the data shown in (B). The uptake rate was leak-corrected.
None
Fig. 5. Direct visualization of Ca2+-induced Ca2+ release in DRG neurons. Simultaneous recordings of cytoplasmic Ca2+ (normalized Fluo-3 fluorescent intensity, upper trace) and [Ca2+]L dynamics recorded from the same neuron are presented. The cell was challenged subsequently by an application of caffeine (20 mM) and by a 3 s step depolarization from –70 to 0 mV (the corresponding Ca2+ current is shown in the inset on the top of the Fluo-3 trace). Note that depolarization triggers an increase in cytoplasmic Ca2+ and a decrease in [Ca2+]L. Selected images of the Mag-Fura-2 ratio are shown near the [Ca2+]L trace. The inset in the right lower corner shows a linear relationship between resting luminal Ca2+ concentration and the amplitude of depolarization-induced [Ca2+]L decrease.
None
Fig. 6. Pharmacological manipulation with CICR. (A) A low (1 mM) caffeine concentration enhances the CICR. The [Ca2+]i (black traces) and [Ca2+]L (red traces) were measured from the same DRG neuron. The neuron was stimulated by 3 s depolarizations in control conditions and in the presence of 1 mM caffeine (the instants of depolarizations are indicated by arrows). Note the significant rise in the amplitude of the [Ca2+]L decrease in the presence of caffeine. The corresponding Ca2+ currents are shown on the lower panel at a higher time resolution. (B) Ryanodine completely inhibits both caffeine- and Ca2+-induced Ca2+ release. The upper panel shows control [Ca2+]i and [Ca2+]L traces (depicted in black and red, respectively) in response to 20 mM caffeine and 3 s depolarization. The lower panel demonstrates the same experiment performed on another neuron from the same culture after 10 min incubation with 50 µM ryanodine. Ca2+ currents are shown in the insets.
None
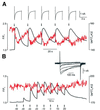
Fig. 7. CICR is graded by Ca2+ entry (1). (A) [Ca2+]L and [Ca2+]i dynamics (red and black traces, respectively) recorded from the DRG neuron stimulated by five consecutive depolarizations (moments of depolarizations are indicated by arrows) from –70 to 0 mV. Ca2+ currents are shown above at a higher time resolution. (B) Similarly to the experiment described above, [Ca2+]L and [Ca2+]i (red and black traces) were recorded in response to step depolarizations of increasing amplitude. Holding potential –70 mV, step increment 10 mV.
None
Fig. 8. CICR is graded by Ca2+ entry (2). (A) Changes in [Ca2+]L (upper panel, red traces) and [Ca2+]i (lower panel, black traces) in response to step depolarizations from –70 mV to 0 mV of increasing duration. (B) Voltage protocol and Ca2+ currents from the experiment shown in (A). (C) The relationship between the charge carried by the Ca2+ current (Q) and the amplitude of the [Ca2+]L decrease (Δ[Ca2+]L) derived from the traces shown in (A) and (B). (D) The ratio between the charge carried by ICa and the amplitude of [Ca2+]L decrease plotted against duration of corresponding Ca2+ currents. Data are mean ± SD derived from five independent experiments similar to those shown in (A).

Similar articles

Cited by

References

    1. Alford S., Frenguelli,B.G., Schofield,J.G. and Collingridge,G.L. (1993) Characterization of Ca2+ signals induced in hippocampal CA1 neurones by the synaptic activation of NMDA receptors. J. Physiol. (Lond.), 469, 693–716. - PMC - PubMed
    1. Alonso M.T., Barrero,M.J., Michelena,P., Carnicero,E., Cuchillo,I., Garcia,A.G., Garcia-Sancho,J., Montero,M. and Alvarez,J. (1999) Ca2+-induced Ca2+ release in chromaffin cells seen from inside the ER with targeted aequorin. J. Cell Biol., 144, 241–254. - PMC - PubMed
    1. Berridge M.J. (1993) Inositoltrisphosphate and calcium signalling. Nature, 361, 315–325. - PubMed
    1. Berridge M.J. (1998) Neuronal calcium signaling. Neuron, 21, 13–26. - PubMed
    1. Bezprozvanny I., Watras,J. and Ehrlich,B.E. (1991) Bell-shaped calcium-response curves of Ins(1,4,5)P3- and calcium-gated channels from endoplasmic reticulum of cerebellum. Nature, 351, 751–754. - PubMed

Publication types

MeSH terms