. 2002 Mar;11(3):500-15.
doi: 10.1110/ps.34602.

Single-domain antibody fragments with high conformational stability

Affiliations

Single-domain antibody fragments with high conformational stability

Mireille Dumoulin et al. Protein Sci. 2002 Mar.

Abstract

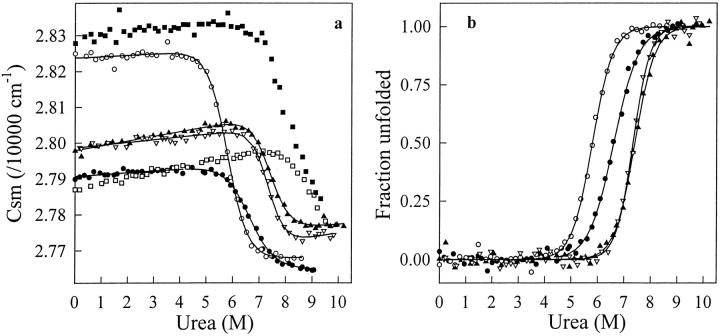
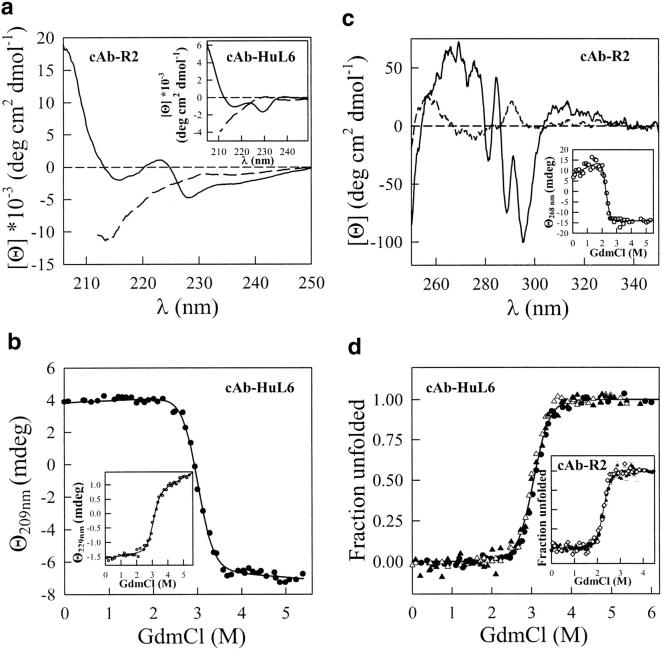
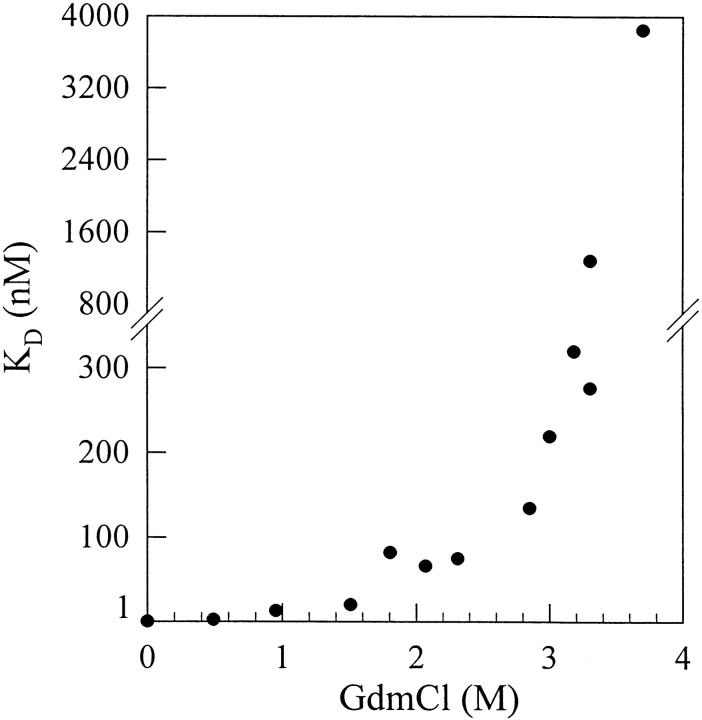
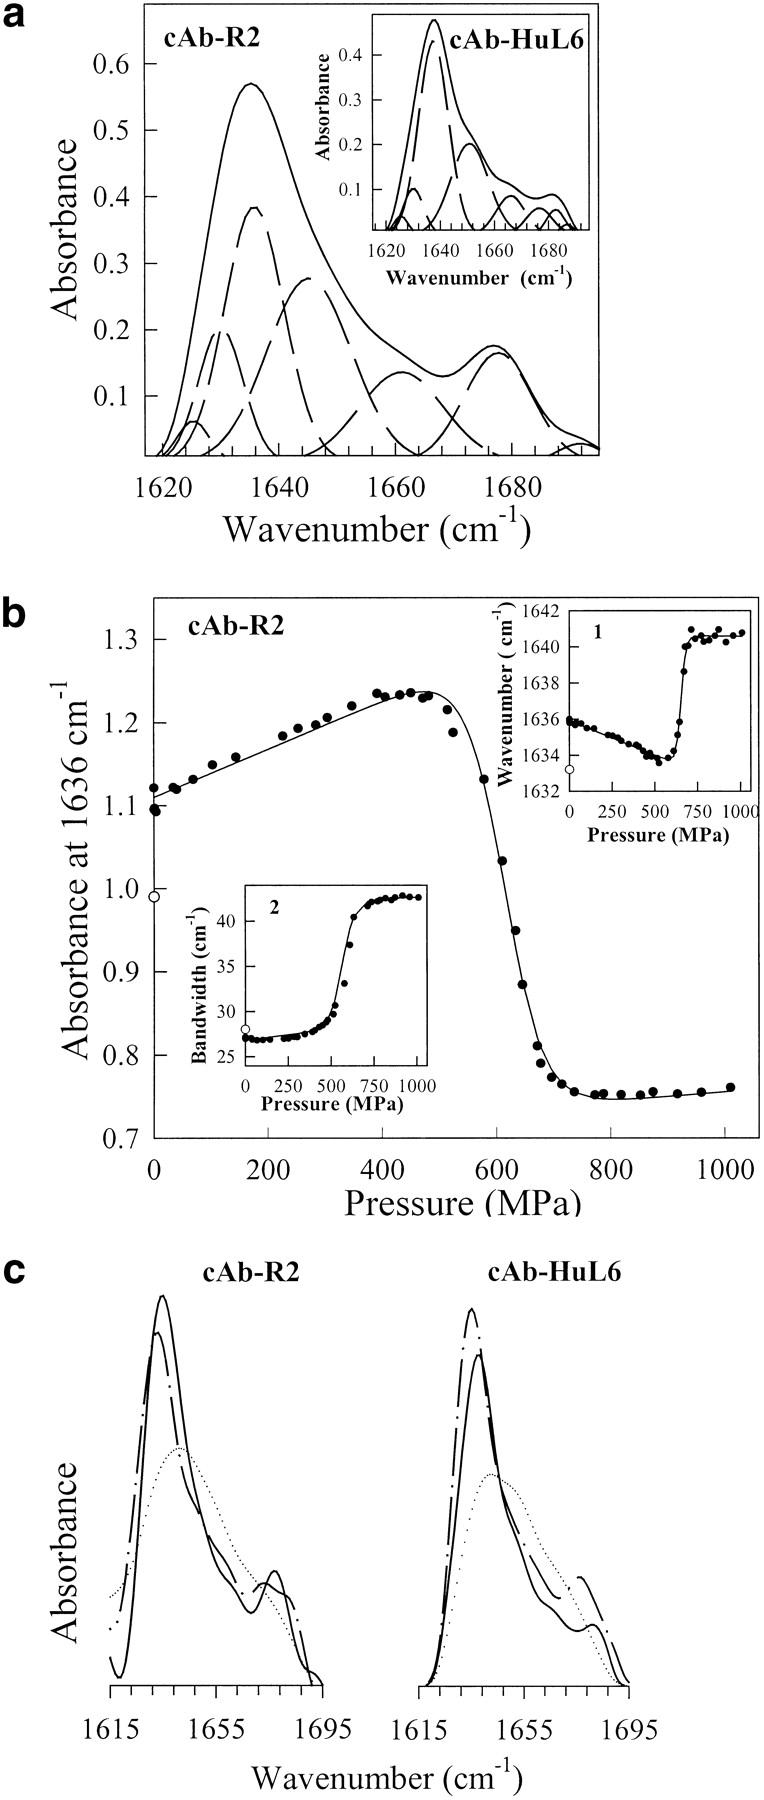
A variety of techniques, including high-pressure unfolding monitored by Fourier transform infrared spectroscopy, fluorescence, circular dichroism, and surface plasmon resonance spectroscopy, have been used to investigate the equilibrium folding properties of six single-domain antigen binders derived from camelid heavy-chain antibodies with specificities for lysozymes, beta-lactamases, and a dye (RR6). Various denaturing conditions (guanidinium chloride, urea, temperature, and pressure) provided complementary and independent methods for characterizing the stability and unfolding properties of the antibody fragments. With all binders, complete recovery of the biological activity after renaturation demonstrates that chemical-induced unfolding is fully reversible. Furthermore, denaturation experiments followed by optical spectroscopic methods and affinity measurements indicate that the antibody fragments are unfolded cooperatively in a single transition. Thus, unfolding/refolding equilibrium proceeds via a simple two-state mechanism (N <--> U), where only the native and the denatured states are significantly populated. Thermally-induced denaturation, however, is not completely reversible, and the partial loss of binding capacity might be due, at least in part, to incorrect refolding of the long loops (CDRs), which are responsible for antigen recognition. Most interestingly, all the fragments are rather resistant to heat-induced denaturation (apparent T(m) = 60-80 degrees C), and display high conformational stabilities (DeltaG(H(2)O) = 30-60 kJ mole(-1)). Such high thermodynamic stability has never been reported for any functional conventional antibody fragment, even when engineered antigen binders are considered. Hence, the reduced size, improved solubility, and higher stability of the camelid heavy-chain antibody fragments are of special interest for biotechnological and medical applications.


Figures

Fig. 1.
Fig. 1.
Amino acid sequence alignment of the six VHHs studied in this work. The fragments, the CDRs, and the amino acid numbering (bottom line) are as defined in Kabat et al. (1991). The cystein residues involved in either an intradomain (C22 and C92) or an interloop disulphide bond (C33 and C100e in cAb-lys3) are in bold type. Note that in cAb-TEM2, C33, and C100a also probably form an interloop link.
Fig. 2.
Fig. 2.
(a) Tryptophan fluorescence spectra of cAb-Lys3 at various GdmCl concentrations. The spectra were recorded at 25°C and the protein concentration was 25 μg mL−1 (1.7 μM) in 20 mM HEPES, pH 7. The excitation wavelength was 295 nm. The inset shows the changes in tryptophan fluorescence intensity observed at 340 nm (filled circles) and 360 nm (open triangles). These data were analyzed on the basis of a two-state model, and the lines represent the best fit to Equation 2, calculated using ΔG(H2O) = 20 ± 5 kJ mole−1 and 16 ± 5 kJ mole−1, and m = 9 ± 2 kJ mole−1 M−1 and 7 ± 2 kJ mole−1 M−1, for data at 340 and 360 nm, respectively; (b) GdmCl-induced denaturation of cAb-Lys3 as shown by the changes in the mass center of the tryptophan fluorescence spectrum (csm). (c) GdmCl-induced unfolding followed by the changes in the fluorescence intensity maximum (λmax). The data in (b) and (c) were analyzed on the basis of a two-state model, and the lines represent the best fit to Equation 2, calculated using ΔG(H2O) = 29 ± 2 kJ mole−1 and 33 ± 2 kJ mole−1, and m = 12.6 ± 0.8 kJ mole−1 M−1 and 14.3 ± 0.8 kJ mole−1 M−1, for (b) and (c), respectively.
Fig. 3.
Fig. 3.
Analysis by surface plasmon resonance spectroscopy of the binding of native and unfolded/refolded cAb-Lys3 to hen lysozyme. (Solid lines) Native fragment; (dotted line) unfolded fragments (25 μg mL−1) in 6.5 M GdmCl/refolded in 50 mM sodium phosphate, pH 7. Different concentrations (20, 100, and 200 nM) of native and unfolded/refolded cAb-Lys3 in HBS buffer were injected at a flow rate of 30 μL min−1.
Fig. 4.
Fig. 4.
(a) GdmCl-induced unfolding transition of cAb-HuL6 (open squares), cAb-Lys3 (filled circles), cAb-NmcA2 (filled squares), cAb-BcII10 (filled triangles), cAb-TEM2 (open triangles), and cAb-R2 (open circles) at pH 7.0, 25°C, monitored by the change in the center of spectral mass (csm) of the fluorescence spectra recorded between 310 and 440 nm. Protein concentrations were 25 μg mL−1 in 20 mM HEPES. Excitation wavelengths were 280 nm (all fragments but cAb-Lys3) and 295 nm (cAb-Lys3). Data were analyzed according to a two-state reaction, and the lines represent the best fits to Equation 2, calculated using the thermodynamic parameters in Table 2; (b) Fraction of VHH unfolded, fU, as a function of GdmCl concentration. The values of fU were calculated from the data in (a), as described in Pace (1986, 1990a).
Fig. 5.
Fig. 5.
(a) Urea-induced unfolding transition of cAb-HuL6 (open squares), cAb-Lys3 (filled circles), cAb-NmcA2 (filled squares), cAb-BcII10 (filled triangles), cAb-TEM2 (open triangles), and cAb-R2 (open circles) at pH 7.0, 25°C, monitored by the change in the center of the spectral mass (csm) of the fluorescence spectra recorded between 310 and 440 nm. Protein concentrations were 25 μg mL−1 in 50 mM phosphate sodium. Excitation wavelengths were 280 nm (all fragments but cAb-Lys3) and 295 nm (cAb-Lys3). Data were analyzed according to a two-state reaction, and the lines represent the best fits to Equation 2, calculated using the thermodynamic parameters in Table 2; (b) Fraction of VHH unfolded, fU, as a function of urea concentration. The values of fU were calculated from the data in (a), as described in Pace (1986, 1990a).
Fig. 6.
Fig. 6.
(a) CD spectra in the far UV region of cAb-R2 and cAb-HuL6 (inset), at pH 7.0, 25°C. (Solid line) Native cAb-R2 and cAb-HuL6 in 10 mM MOPS and in 10 mM HEPES, respectively; (broken line) in 4 M GdmCl, same buffers. The protein concentrations were 0.2 mg mL−1 (14 μM) in a 0.1 cm cell; (b) GdmCl-induced unfolding transition of cAb-HuL6 followed by far UV CD measurements at 209 and 229 nm (inset). The protein concentrations were 1 mg mL−1 (72 μM) in a 0.01-cm cell. Data were analyzed on the basis of a two-state model, and the lines represent the best fit to Equation 2, calculated using ΔG(H2O) = 43 ± 6 kJ mole−1 and 37 ± 4 kJ mole−1, and m = 14.5 ± 2 kJ mole−1 M−1 and 12 ± 1.5 kJ mole−1 M−1, at 209 and 229 nm, respectively; (c) CD spectra in the near UV region of cAb-R2, at pH 7.0, 25°C. Solid line, in 10 mM HEPES; broken line, in 10 mM HEPES and 5.5 M GdmCl. The protein concentration was 0.2 mg mL−1 in a 1-cm cell. The equilibrium unfolding transition of cAb-R2 followed by CD measurements at 268 nm is shown as an inset. The lines represent the best fit to Equation 2, calculated using ΔG(H2O) = 42 ± 10 kJ mole−1 and m = 18 ± 4 kJ mole−1 M−1; (d) Fraction of cAb-HuL6 unfolded, fU, as a function of GdmCl concentration, at pH 7.0, 25°C. The fU values were calculated from data obtained by fluorescence (filled circles), far UV CD at 209 nm (open triangles), and far UV CD at 229 nm (filled triangles). The inset shows the unfolded fraction of cAb-R2 as monitored by intrinsic fluorescence (filled circles), far UV CD at 212 nm (open triangles), far UV CD at 222 nm (filled triangles), and near UV CD at 268 nm (open diamonds). The continuous lines were drawn using the parameters obtained in CD (at 229 nm; cAb-HuL6) and intrinsic fluorescence (cAb-R2) experiments.
Fig. 7.
Fig. 7.
GdmCl-induced unfolding of cAb-HuL6 followed by SPR spectroscopy, using a BIAcore X instrument. Protein fragments (0.07 mg mL−1, i.e., 5 μM in HBS buffer) were incubated overnight at 25°C in the presence of varying concentrations of GdmCl. VHHs were then diluted to yield concentrations in the range from 0.6 to 4800 nM, in varying GdmCl concentrations. Ninety microliters of each solution were injected at a flow rate allowing the equilibrium to be reached (i.e., 2–30 μL min−1), using GdmCl-containing HBS buffer. For each GdmCl concentration, at least eight protein concentrations were injected. Under these equilibrium conditions, the KD value corresponds to the concentration of VHH leading to half-saturation.
Fig. 8.
Fig. 8.
(a) Fourier-deconvoluted and fitted infrared spectra in the amide I` region (solid lines) with individual Gaussian components (broken lines) of cAb-R2 and cAb-HuL6 (inset). IR spectra were recorded at atmospheric pressure (0.1 MPa) and 25°C, using protein concentrations of about 50 mg mL−1 (∼3.6 mM) in 1 M 13C-urea and 10 mM TrisDCl, pD 7.6; (b) Pressure-induced unfolding curves of cAb-R2 followed by IR measurements. The absorbance at 1636 cm−1, the wavenumber corresponding to the maximum in absorbance (inset 1), and the amide I` bandwidth (inset 2) were used to monitor VHH unfolding. The solid lines represent the best fits of the data to Equation 3, as calculated from the parameters in Table 4. In each case, the value of the refolded state is indicated (open circles); (c) FTIR spectra of cAb-R2 and cAb-HuL6 under native (0.1 MPa; continuous line), unfolding (1060 MPa, dotted line) and refolding (0.1 MPa; broken line) conditions.

References

    1. Artymiuk, P.J. and Blake, C.C.F. 1981. Refinement of human lysozyme at 1.5 Å resolution. J. Mol. Biol. 152: 737–762. - PubMed
    1. Better, M., Chang, C.P., Robinson, R.R., and Horwitz, A.H. 1988. Escherichia coli secretion of an active chimeric antibody fragment. Science 240: 1041–1043. - PubMed
    1. Bird, R.E., Hardman, K.D., Jacobson, J.W., Johnson, S., Kaufman, B.M., Lee, S.M., Lee, T., Pope, S.H., Riordan, G.S., and Whitlow, M. 1988. Single-chain antigen-binding proteins. Science 242: 423–426. - PubMed
    1. Blake, C.C.F., Koenig, D.F., Mair, G.A., and Sarma, R. 1965. Crystal structure of lysozyme by X-ray diffraction. Nature 206: 757–761. - PubMed
    1. Byler, D.M. and Susi., H. 1986. Examination of the secondary structure of proteins by deconvolved FTIR spectra. Biopolymers 25: 469–487. - PubMed

Publication types