

Review
doi: 10.1136/bmj.324.7334.415.
ABC of clinical electrocardiography.Introduction. I-Leads, rate, rhythm, and cardiac axis
- PMID: 11850377
- PMCID: PMC1122339
- DOI: 10.1136/bmj.324.7334.415
Item in Clipboard
Review
ABC of clinical electrocardiography.Introduction. I-Leads, rate, rhythm, and cardiac axis
BMJ.
.
No abstract available
Figures
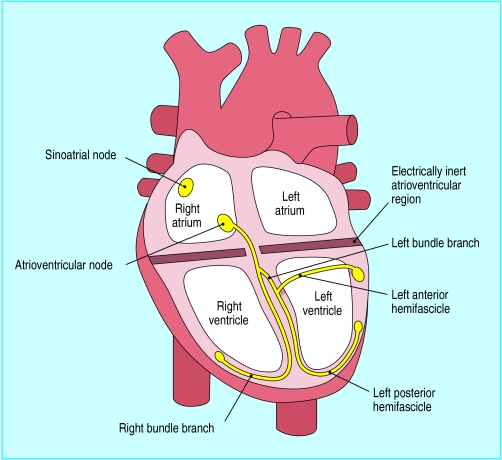
The His-Purkinje conduction system

Standard calibration signal
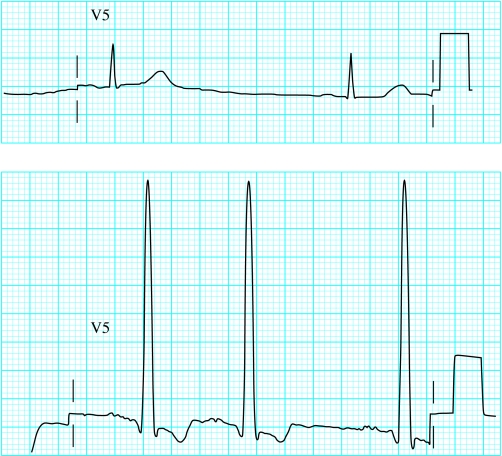
Role of body habitus and disease on the amplitude of the QRS complex. Top: Low amplitude complexes in an obese woman with hypothyroidism. Bottom: High amplitude complexes in a hypertensive man

Wave of depolarisation. Shape of QRS complex in any lead depends on orientation of that lead to vector of depolarisation

Position of the six chest electrodes for standard 12 lead electrocardiography. V1: right sternal edge, 4th intercostal space; V2: left sternal edge, 4th intercostal space; V3: between V2 and V4; V4: mid-clavicular line, 5th space; V5: anterior axillary line, horizontally in line with V4; V6: mid-axillary line, horizontally in line with V4
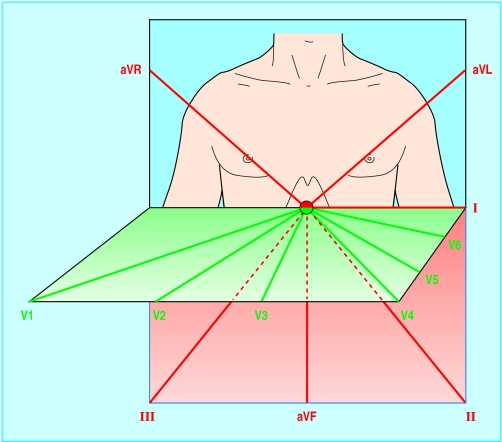
Vertical and horizontal perspective of the leads. The limb leads “view” the heart in the vertical plane and the chest leads in the horizontal plane
Regular rhythm: the R-R interval is two large squares. The rate is 150 beats/min (300/2=150)
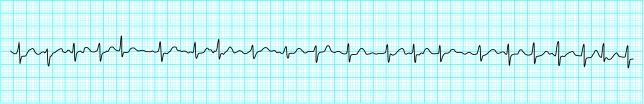
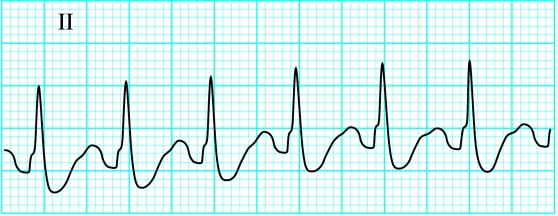
A standard rhythm strip is 25 cm long (that is, 10 seconds). The rate in this strip (showing an irregular rhythm with 21 intervals) is therefore126 beats/min (6×21). Scale is slightly reduced here
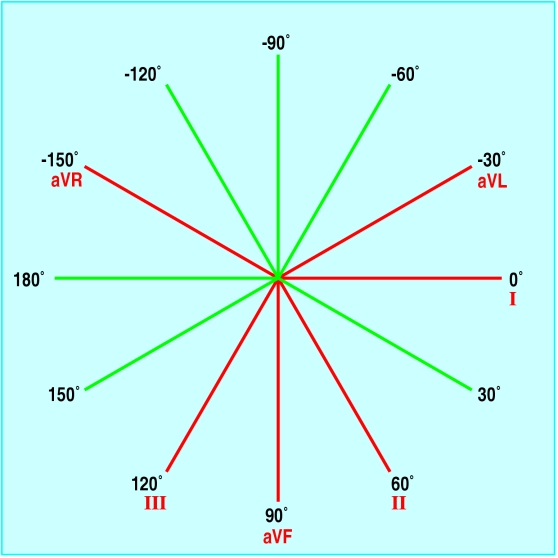
Hexaxial diagram (projection of six leads in vertical plane) showing each lead's view of the heart
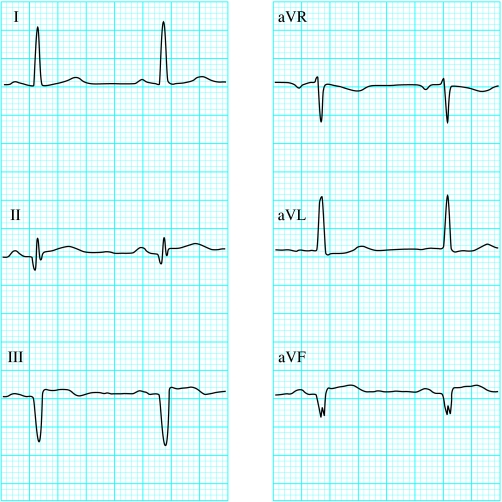
Determination of cardiac axis using the hexaxial diagram (see previous page). Lead II (60°) is almost equiphasic and therefore the axis lies at 90° to this lead (that is 150° to the right or −30° to the left). Examination of the adjacent leads (leads I and III) shows that lead I is positive. The cardiac axis therefore lies at about −30°
Publication types
MeSH terms
LinkOut - more resources
Full Text Sources
Other Literature Sources
Medical