. 2002 Feb 15;22(4):1350-62.
doi: 10.1523/JNEUROSCI.22-04-01350.2002.

Ionic mechanism of ouabain-induced concurrent apoptosis and necrosis in individual cultured cortical neurons

Affiliations

Ionic mechanism of ouabain-induced concurrent apoptosis and necrosis in individual cultured cortical neurons

Ai Ying Xiao et al. J Neurosci. .

Abstract

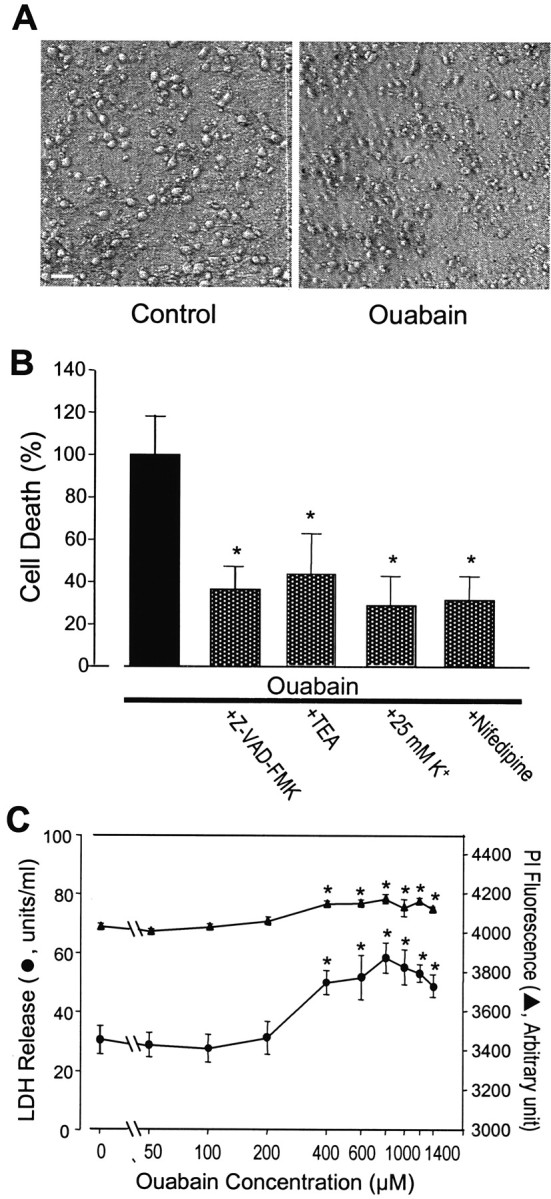
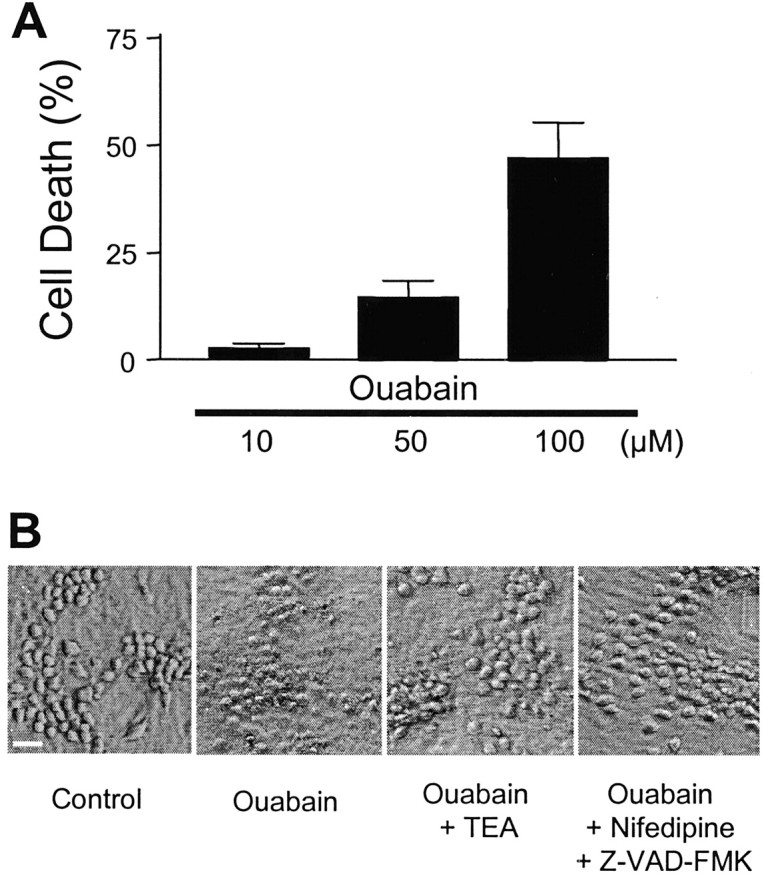
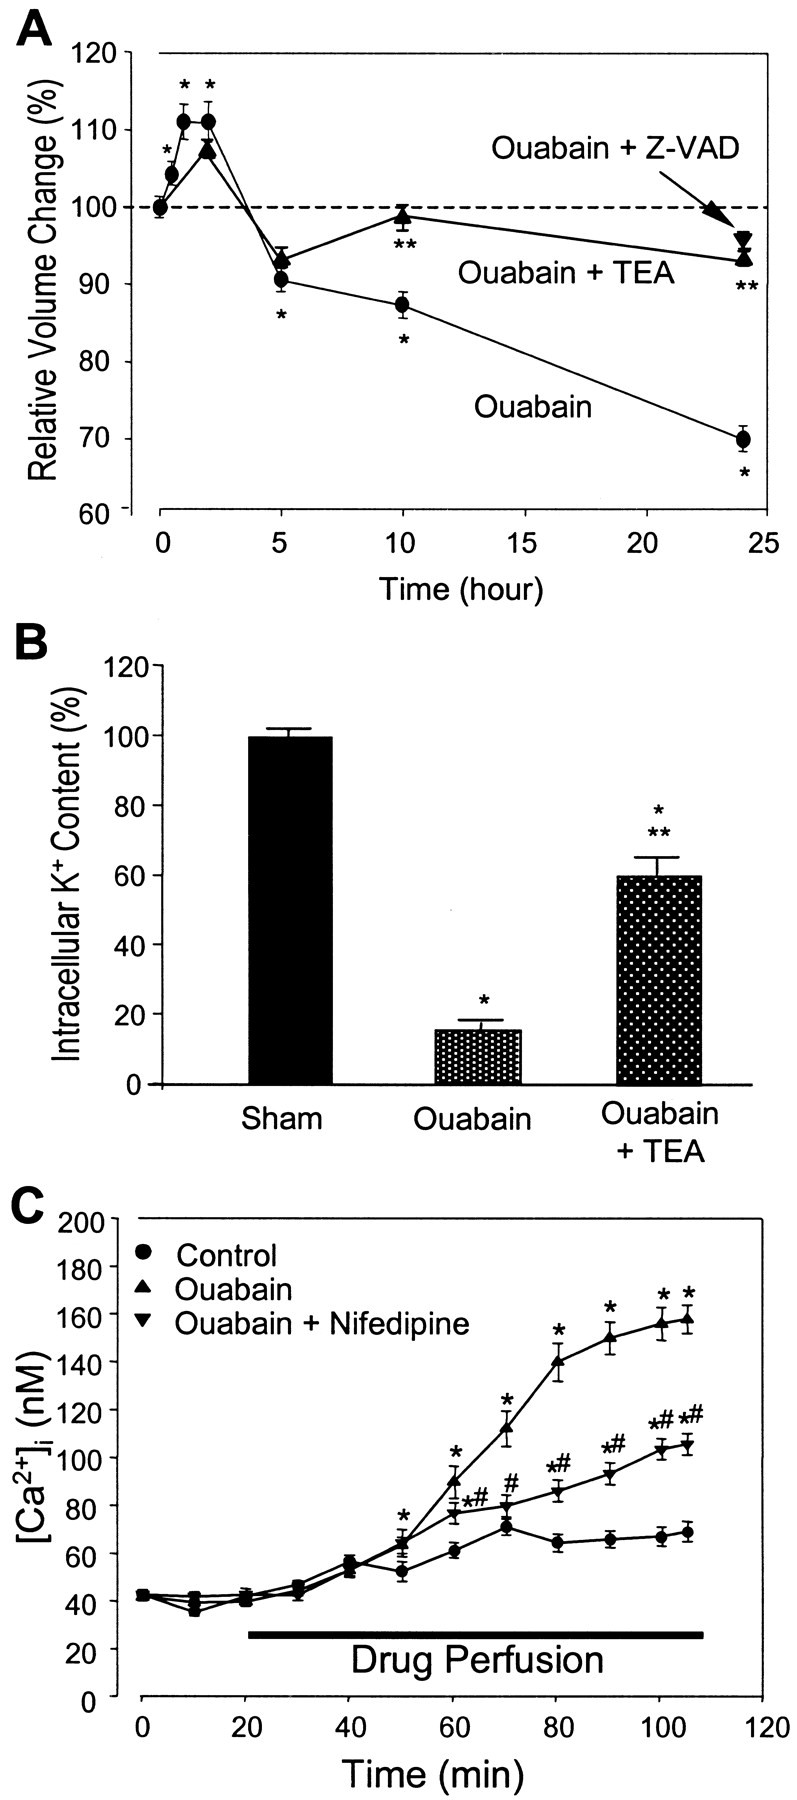
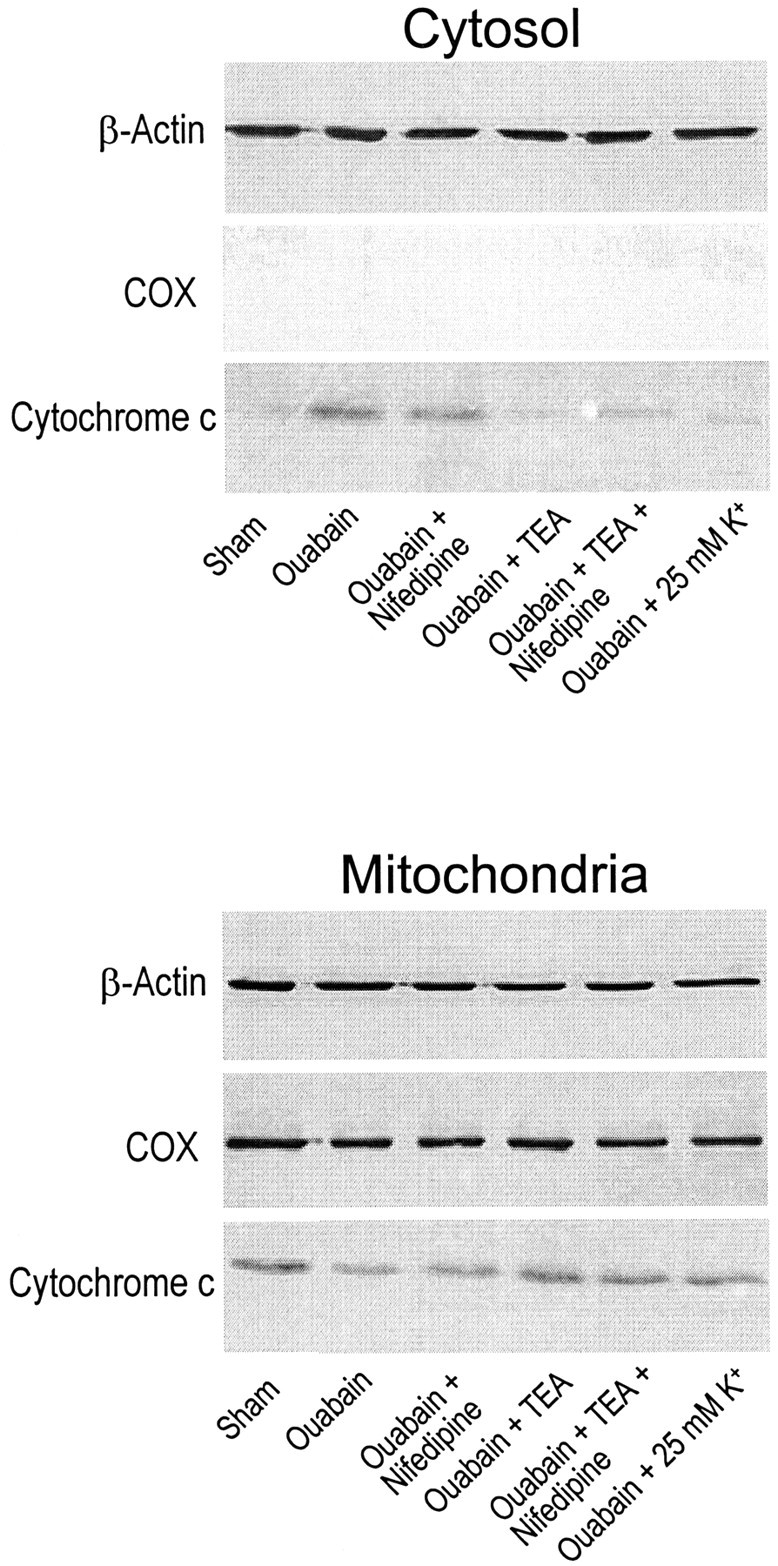
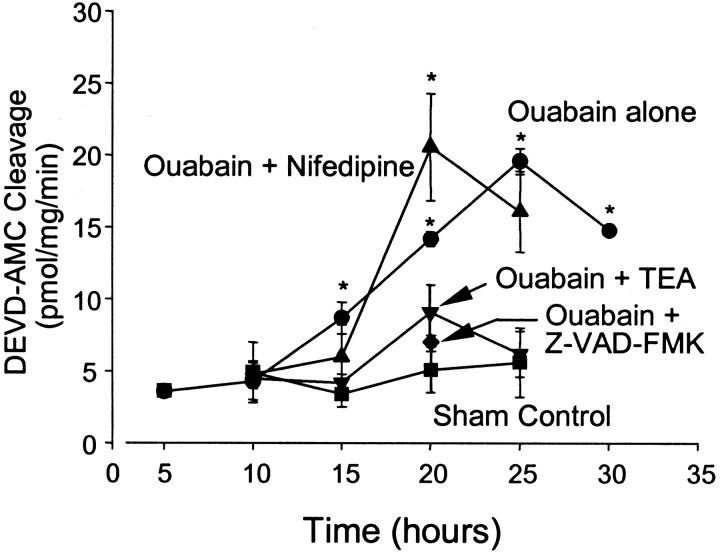
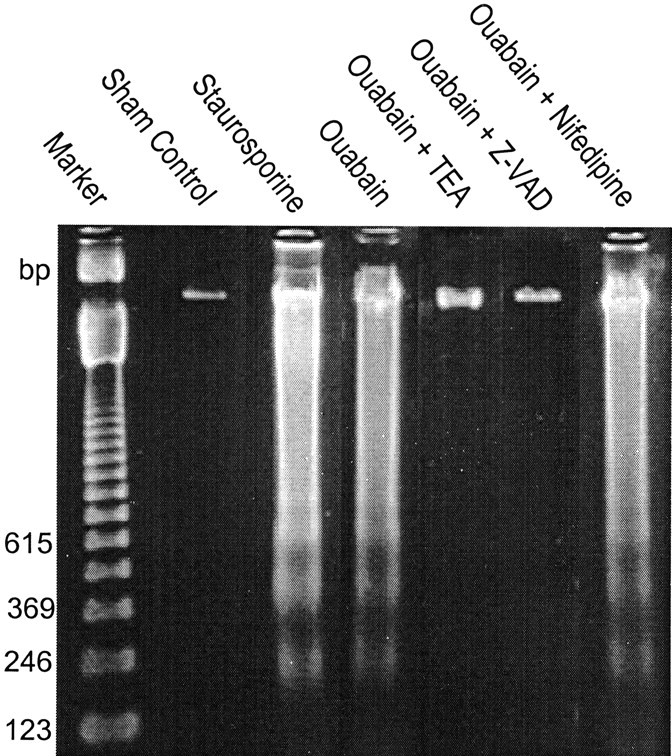
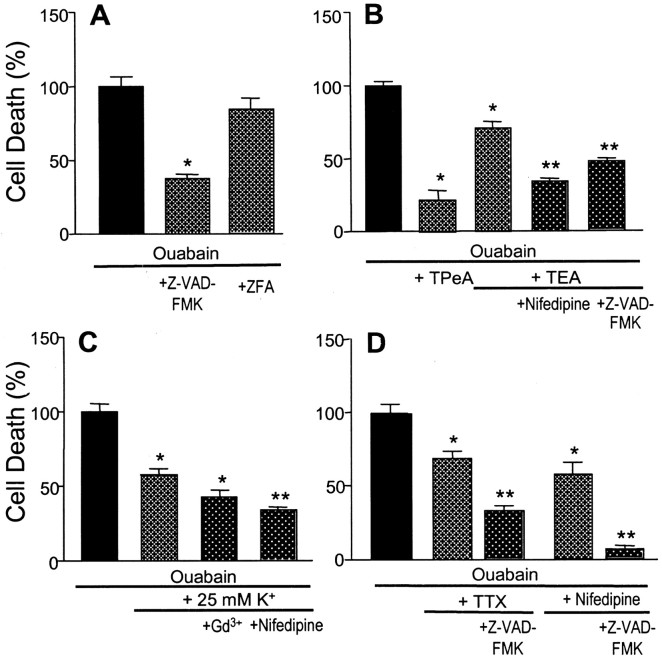
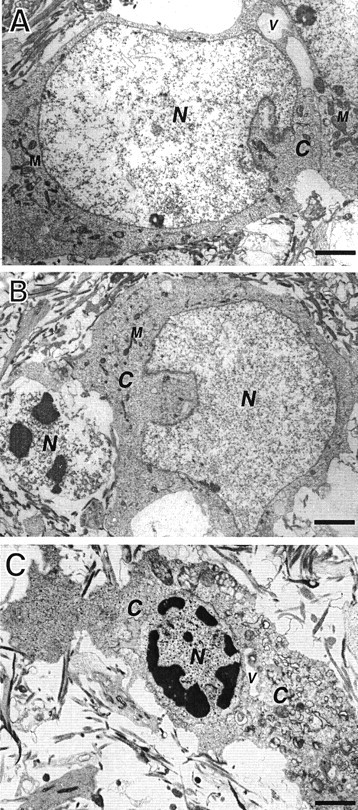
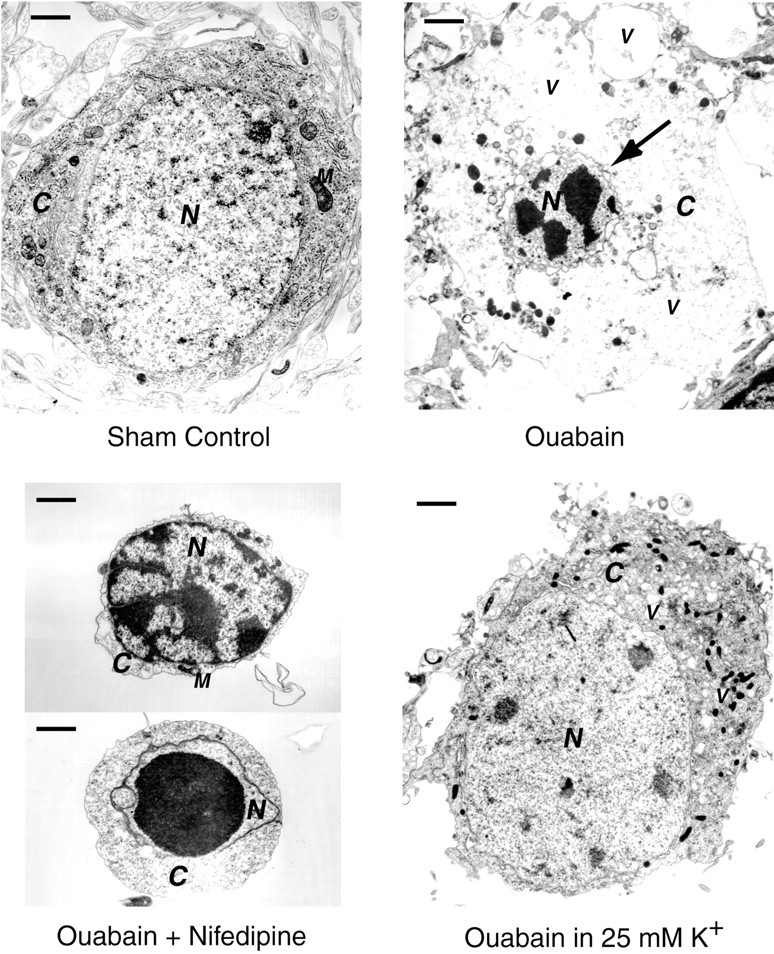
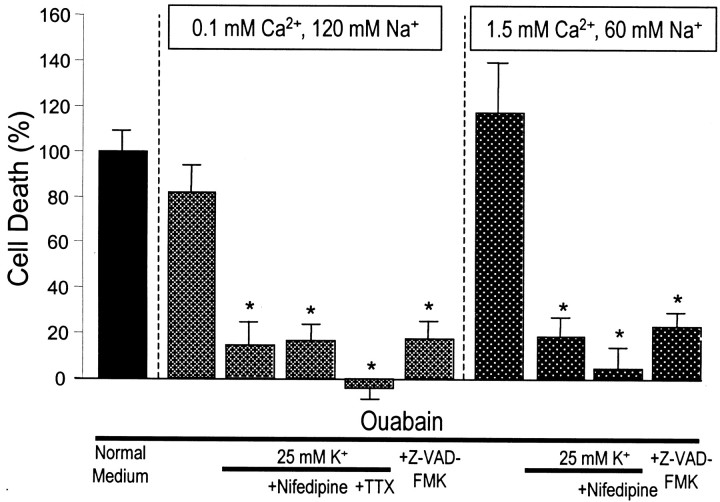
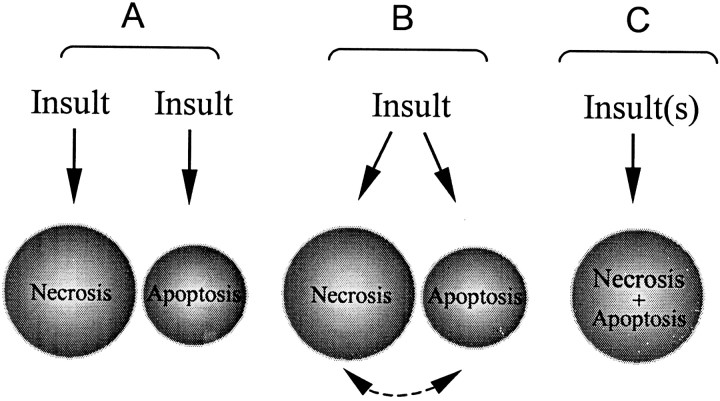
Energy deficiency and dysfunction of the Na+, K+-ATPase are common consequences of many pathological insults. The nature and mechanism of cell injury induced by impaired Na+, K+-ATPase, however, are not well defined. We used cultured cortical neurons to examine the hypothesis that blocking the Na+, K+-ATPase induces apoptosis by depleting cellular K+ and, concurrently, induces necrotic injury in the same cells by increasing intracellular Ca2+ and Na+. The Na+, K+-ATPase inhibitor ouabain induced concentration-dependent neuronal death. Ouabain triggered transient neuronal cell swelling followed by cell shrinkage, accompanied by intracellular Ca2+ and Na+ increase, K+ decrease, cytochrome c release, caspase-3 activation, and DNA laddering. Electron microscopy revealed the coexistence of ultrastructural features of both apoptosis and necrosis in individual cells. The caspase inhibitor Z-Val-Ala-Asp(OMe)-fluoromethyl ketone (Z-VAD-FMK) blocked >50% of ouabain-induced neuronal death. Potassium channel blockers or high K+ medium, but not Ca2+ channel blockade, prevented cytochrome c release, caspase activation, and DNA damage. Blocking of K+, Ca2+, or Na+ channels or high K+ medium each attenuated the ouabain-induced cell death; combined inhibition of K+ channels and Ca2+ or Na+ channels resulted in additional protection. Moreover, coapplication of Z-VAD-FMK and nifedipine produced virtually complete neuroprotection. These results suggest that the neuronal death associated with Na+, K+-pump failure consists of concurrent apoptotic and necrotic components, mediated by intracellular depletion of K+ and accumulation of Ca2+ and Na+, respectively. The ouabain-induced hybrid death may represent a distinct form of cell death related to the brain injury of inadequate energy supply and disrupted ion homeostasis.


Figures

Fig. 1.
Fig. 1.
Effects of ouabain on pure-neuronal and pure-glial cultures. A, Phase-contrast micrographs of pure-neuronal cultures show control neurons and neurons displaying cell shrinkage and cell degeneration after 20 hr exposure to 80 μm ouabain and 1 μm MK-801. Scale bar, 50 μm. B, Ouabain (80 μm), in the presence of 1 μm MK-801, caused significant cell death in pure-neuronal cultures in 24 hr. The ouabain-induced neuronal death, normalized as 100%, was drastically reduced by the caspase inhibitor Z-VAD-FMK (100 μm). The K+ channel blocker TEA (5 mm) and the Ca2+ channel antagonist nifedipine (1 μm) attenuated the ouabain toxicity, indicating that cellular K+ depletion and Ca2+ accumulation were each partially responsible for the neuronal death. Reducing K+ efflux by elevating extracellular K+ from 5 to 25 mm also attenuated ouabain toxicity. n= 8–16 cultures. C, Neither LDH release nor PI staining detected any toxicity in the pure-glia culture until the ouabain concentration reached 400 μm. n = 8–16 cultures. Asterisks indicate a significant difference (p < 0.05) from the ouabain alone control (B) and from the ouabain-free controls (C).
Fig. 2.
Fig. 2.
Ouabain induced neuronal death in neuron–glia cultures. A, Ouabain caused concentration-dependent neuronal death in 24 hr in neocortical cultures containing neurons on a glial bed. Cell death was measured as LDH release and normalized to complete killing by 300 μm NMDA. B, Phase-contrast photos of cortical cells before and after 24 hr exposure to 80 μm ouabain. Ouabain triggered widespread neuronal injury; no glial damage was detected. TEA (30 mm) coapplied with ouabain attenuated ouabain toxicity. Combined application of 1 μm nifedipine and 100 μm Z-VAD-FMK almost completely blocked ouabain-induced death. Scale bar, 50 μm.
Fig. 3.
Fig. 3.
Ouabain-induced disruptions of ion homeostasis and cell volume changes. A, Ouabain treatment initiated an acute phase of cell body swelling that peaked at 1–2 hr. Approximately 5 hr after ouabain was added, cells started to undergo a progressive volume decrease. The cell body shrinkage was largely prevented by 30 mm TEA; the initial cell swelling was not affected by TEA. The ouabain-induced cell volume decrease was also prevented by the caspase inhibitor Z-VAD-FMK (100 μm).n = 100–150 cells for each time point (n = 150 for Z-VAD-FMK experiment). Thesingle asterisks in A show p < 0.05 compared with time 0 controls. The double asterisks inA show a significant difference (p < 0.05) from the ouabain group at the same time points. B, Ouabain (80 μm, 10–15 hr exposure) induced a massive depletion of cellular K+. The K+ loss was attenuated by 30 mm TEA (Similar results were obtained by the K+-selective electrode and ICP-MS method. Shown in the figure are the results from the K+-selective electrode assay.) Ouabain also caused increases in intracellular Na+ (see Results). Ouabain induced similar K+ depletion in pure-neuronal cultures (data not shown). n = 3 measurements for time-matched sham control and TEA group;n = 6 for ouabain-treated group. The single asterisks in B show p < 0.05 compared with the sham control. The double asterisks in B show a significant difference (p < 0.05) from ouabain alone.C, Ouabain-induced [Ca2+]i increase in cortical neurons. Intracellular free Ca2+ concentration was measured by fluorescence imaging with Fura-2 AM. Compared with sham control cells (n = 13), application of 100 μmouabain gradually increased [Ca2+]istarting at ∼30 min after ouabain was added; [Ca2+]i reached a plateau level in 80–90 min (n = 23). The ouabain-induced [Ca2+]i increase was largely blocked by coapplied 1 μm nifedipine (n = 28). MK-801 (1 μm) was added in experiments. *p < 0.05 compared with controls;#p < 0.05 compared with ouabain alone at the same time points.
Fig. 4.
Fig. 4.
Effects of nifedipine, TEA, and potassium on ouabain-induced cytochrome c release. Cytochromec release was detected by Western blot in the cytosolic fraction 20 hr after incubation with 80 μm ouabain (top panel), with corresponding reduction of mitochondrial cytochrome c (bottom panel). Cytochrome c release was drastically attenuated by TEA (30 mm) or elevated extracellular K+ (25 mmK+); on the other hand, it was not affected by nifedipine (1 μm). COX in mitochondrial fraction and its absence in cytosolic fraction demonstrated that the intact mitochondria separated from cytosol in our analysis. The β-actin analysis was performed as an internal control. The results shown are representative of three independent experiments. When nifedipine was combined with TEA, there appeared to be more cytochrome c release into the cytosol compared with the release with TEA alone, suggesting that the membrane depolarization induced by TEA might facilitate the voltage-dependent block of Ca2+ channels by dihydropyridine derivatives such as nifedipine (Sanguinetti and Kass, 1984) and thus might be favorable for a low Ca2+stimulated apoptotic process (Yu et al., 2001).
Fig. 5.
Fig. 5.
Effects of TEA and nifedipine on ouabain-induced caspase-3 activation. Caspase-3 activity was correlated with the cleavage of the specific substrate DEVD-AMC. In sham control experiments, caspase-3 activity was stable at a low level for 25 hr (▪). Incubation with 80 μm ouabain increased the caspase activity in a time-dependent manner (●); the increase was blocked by Z-VAD-FMK (100 μm) (♦) and TEA (30 mm) (▾) but not by nifedipine (1 μm) (▴). Nifedipine even appeared to accelerate the process of caspase activation. n = 3–5 independent measurements for each time point. *p < 0.05 compared with sham controls at the same time points.
Fig. 6.
Fig. 6.
Ouabain-induced DNA fragmentation. Ouabain (80 μm) exposure of 20 hr induced DNA fragmentation (laddering), revealed by agarose gel electrophoresis. The pattern of DNA damage was similar to that induced by the typical apoptosis inducer staurosporine (0.2 μm). No DNA fragmentation occurred in control cells. Ouabain-induced DNA laddering was prevented by coapplied TEA (30 mm) or Z-VAD-FMK (100 μm), but not by nifedipine (1 μm). Similar results were obtained from three independent experiments. Data shown in the figure were from one experiment; the position of columns was rearranged for purpose of clarity.
Fig. 7.
Fig. 7.
Block of ouabain-induced cell death in cortical neuron–glia cultures. Ouabain-induced neuronal death in cortical cultures containing neurons and a glial bed was measured by LDH release after 24 hr exposure and normalized to the cell death induced by 80 μm ouabain. A, The broad-spectrum caspase inhibitor Z-VAD-FMK (100 μm) blocked 65 ± 4% of cell death, whereas its negative control ZFA (100 μm) showed no significant protection (p = 0.16).B, Potassium channel blocker TEA (30 mm) or TPeA (10 μm) partly reduced the ouabain-induced neuronal death; coapplied 1 μm nifedipine or 100 μmZ-VAD-FMK provided extra protection. TPeA showed substantial protection, presumably because of its additional nonspecific block on Ca2+ channels (Wang et al., 2000). C, Elevated extracellular K+ (25 mm KCl) attenuated ouabain-induced death; additional protection was obtained with coapplied Ca2+ channel antagonist 2 μm gadolinium (Gd3+) or 1 μm nifedipine. D, Nifedipine (1 μm) or the Na+ channel blocker TTX (1 μm) also partially prevented the ouabain toxicity. Maximal neuroprotection was achieved by combining nifedipine with Z-VAD-FMK. n ≥ 12 for each column except for ZFA and TTX (n = 8). *p < 0.05 compared with ouabain alone; **p < 0.05 compared with ouabain plus one treatment.
Fig. 8.
Fig. 8.
Morphological changes of hybrid cell death at early time points of ouabain exposure. EM images reveal ouabain-induced ultrastructural alterations in cortical neurons; morphology of a normal neuron can be seen in Figure 9. A, Two hours after adding 100 μm ouabain plus 1 μm MK-801, some cells started to show signs of nuclear changes; the electron micrograph shows an irregular shape of the nucleus, implying a volume decrease. Meanwhile, swelling mitochondria were observed in many cells. B, Apoptotic features such as nuclear shrinkage and condensation of the nuclear chromatin were advanced after 5 hr in ouabain. Necrotic changes such as cytoplasm swelling, formation of vacuoles, and disruptions of cellular organelles and the plasma membrane also appeared at earlier hours. The two cells shown in this micrograph represent different stages of morphological changes observed at this time. C, Ten hours after onset of ouabain exposure, injured cells with highly condensed nuclei, chaotic cytoplasm, and disrupted plasma membrane were easily detected. Scale bar, 3.0 μm. N, Nucleus; C, cytoplasm; M, mitochondria; V, vacuole.
Fig. 9.
Fig. 9.
Ouabain-induced ultrastructural alterations and effects of nifedipine and high K+ medium. Electron micrographs show a control neuron and reveal striking morphological distinctions after different treatments. The normal cortical neuron has a relatively small cytoplasm and a large nucleus; the cell and cellular organelles are surrounded by intact membranes. Approximately 15 hr after incubation in 100 μm ouabain and 1 μmMK-801, injured cells show apoptotic features such as highly condensed nuclei and dark chromatin clumps (arrow) accompanied by necrotic changes, including cytoplasmic edema manifested by vacuolization and decreased cytoplasmic density, loss of cellular organelles, and breakdown of the plasma membrane. In another experiment, the Ca2+ channel antagonist nifedipine (1 μm), coapplied with ouabain, mostly eliminated necrotic alterations. Two representative injured cells show typical apoptotic morphology, including highly condensed nuclei and cytoplasm, dark chromatin masses (pyknosis) with or without fragmentation, intact cellular organelles, and intact plasma membrane. Reducing K+ efflux, on the other hand, by raising extracellular K+ to 25 mm resulted in the morphological pattern of necrotic injury in most cells. A representative cell shows that ouabain in the high K+ medium induced chaotic alterations in the swollen cytoplasm. No single intact cellular organelle can be detected in the cell; instead, lucent vacuoles appear in the cytoplasm. The cell membrane is deteriorating, but there is little or no nuclear/cellular shrinkage and no chromatin condensation or fragmentation. Scale bars, 2.0 μm. N, Nucleus; C, cytoplasm; M, mitochondria; V, vacuole.
Fig. 10.
Fig. 10.
Ouabain-induced K+ efflux-sensitive and caspase-dependent neuronal death in low Ca2+ or low Na+conditions. A 3 hr exposure to 80 μm ouabain plus 1 μm MK-801 in a low Ca2+ (0.1 mm CaCl2) or a low Na+ (60 mm NaCl) medium induced a dominant neuronal death that was highly sensitive to block by 25 mm K+ or Z-VAD-FMK (100 μm). Without ouabain, the low Ca2+ or low Na+ medium was not toxic (3 hr exposure; data not shown). In the low Ca2+ medium containing a normal concentration of Na+, the Ca2+ channel antagonist nifedipine (1 μm) did not show any effect on the neuroprotection produced by elevated K+, whereas combination of high K+ and the Na+ channel blocker TTX (1 μm) completely prevented cell death. In the low-Na+ medium containing normal Ca2+, an additional protective effect was obtained by combining high K+ and nifedipine (TTX was not tested in this paradigm). Cell death is normalized to the injury induced by 80 μm ouabain in medium containing normal concentrations of CaCl2 (1.5 mm) and NaCl (120 mm) (MEM supplemented with glucose, FBS, HS, and EGF; see Materials and Methods). This medium was used to wash out ouabain after the 3 hr incubation. Cell death was measured by LDH release 24 hr after the onset of exposure. Osmolarity was maintained by adding appropriate amounts of NMDG and HCl; pH was 7.4. n= 8–32. *p < 0.05 compared with ouabain alone.
Fig. 11.
Fig. 11.
Cell death models for necrosis, apoptosis, and hybrid death. A, The conventional cell death model predicts that necrosis and apoptosis are triggered by separate insults and exhibit typical distinctive morphological changes in injured cells.B, Emerging opinion suggests that the same insult may induce either necrosis or apoptosis in different cells; alternatively, a necrotic injury may convert to apoptotic injury or vice versa.C, Recent observations and the present study support the third possibility that a single or multiple insult(s) may trigger parallel pathways leading to necrotic and apoptotic damages in the same cells, identified as hybrid cell death.

Similar articles

Cited by

References

    1. Ahlemeyer B, Weintraut H, Schoner W. Cultured chick-embryo heart cells respond differently to ouabain as measured by the increase in their intracellular Na+ concentration. Biochem Biophys Acta. 1992;1137:135–142. - PubMed
    1. Ameisen JC. Programmed cell death (apoptosis) and cell survival regulation: relevance to AIDS and cancer. AIDS. 1994;8:1197–1213. - PubMed
    1. Ankarcrona M, Dypbukt JM, Bonfoco E, Zhivotovsky B, Orrenius S, Lipton SA, Nicotera P. Glutamate-induced neuronal death: a succession of necrosis or apoptosis depending on mitochondrial function. Neuron. 1995;15:961–973. - PubMed
    1. Archibald JT, White TD. Rapid reversal of internal Na+ and K+ contents of synaptosomes by ouabain. Nature. 1974;252:595–597. - PubMed
    1. Armstrong RC, Aja TJ, Hoang KD, Gaur S, Bai X, Alnemri ES, Litwack G, Karanewsky DS, Fritz LC, Tomaselli KJ. Activation of the CED3/ICE-related protease CPP32 in cerebellar granule neurons undergoing apoptosis but not necrosis. J Neurosci. 1997;17:553–562. - PMC - PubMed

Publication types

MeSH terms