. 2002 Feb 15;22(4):1373-84.
doi: 10.1523/JNEUROSCI.22-04-01373.2002.

Hippocampal population activity during the small-amplitude irregular activity state in the rat

Affiliations

Hippocampal population activity during the small-amplitude irregular activity state in the rat

Beata Jarosiewicz et al. J Neurosci. .

Abstract

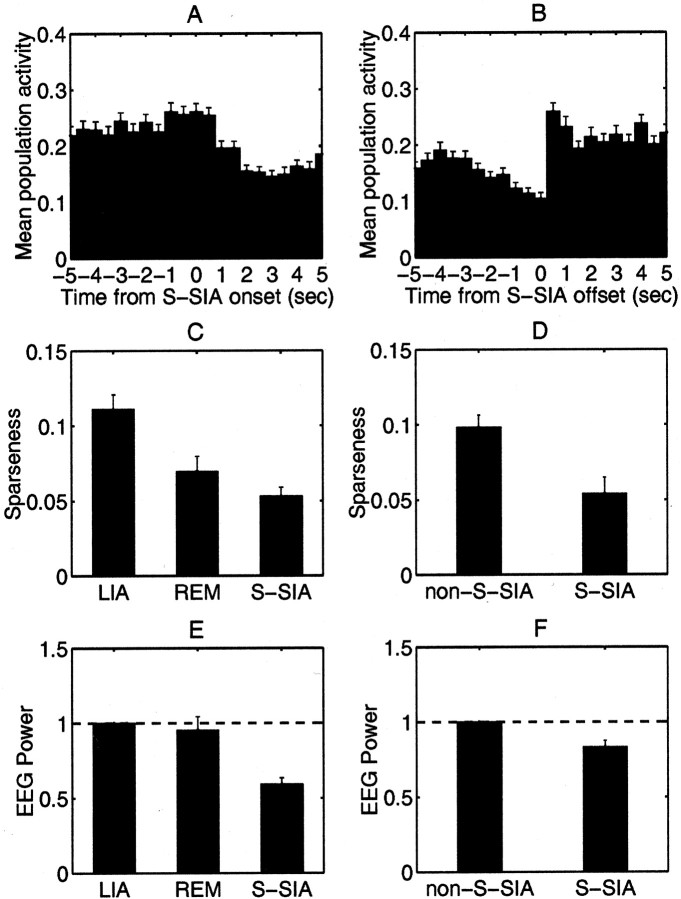
The sleeping rat cycles between two well-characterized physiological states, slow-wave sleep (SWS) and rapid-eye-movement sleep (REM), often identified by the presence of large-amplitude irregular activity (LIA) and theta activity, respectively, in the hippocampal EEG. Inspection of the activity of ensembles of hippocampal CA1 complex-spike cells along with the EEG reveals the presence of a third physiological state within SWS. We characterize the hippocampal EEG and population activity of this third state relative to theta activity and LIA, its incidence relative to REM and LIA, and the functional correlates of its population activity. This state occurs repeatedly within stretches of SWS, occupying approximately 33% of SWS and approximately 20% of total sleep, and it follows nearly every REM episode; however, it never occurs just before a REM episode. The EEG during this state becomes low in amplitude for a few seconds, probably corresponding to "small-amplitude irregular activity" (SIA) described in the literature; we will call its manifestation during sleep "S-SIA." During S-SIA, a small subset of cells becomes active, whereas the rest remain nearly silent, with the same subset of cells active across long sequences of S-SIA episodes. These cells are physiologically indistinguishable from ordinary complex-spike cells; thus, the question arises as to whether they have any special functional correlates. Indeed, many of these cells are found to have place fields encompassing the location where the rat sleeps, raising the possibility that S-SIA is a state of increased alertness in which the animal's location in the environment is represented in the brain.


Figures

Fig. 1.
Fig. 1.
Hippocampal physiological states. Fifteen second sample epochs from a single recording session (p119-03) showing an EEG recorded near the hippocampal fissure (top); a raster of spikes from the ensemble of 54 simultaneously recorded CA1 pyramidal cells (middle); and the animal's velocity, with 0 aligned at the bottom of the plot (bottom).A, Awake exploration of the recording environment. Note the theta activity in the EEG trace, the population activity reflecting the place selectivity of the recorded cells, and the nonzero velocity, indicating movement. B, REM. Note the regular theta oscillation in the EEG and the characteristic population activity, both similar to run. The velocity trace is mostly 0, indicating a lack of gross movement. (The occasional transients in the velocity traces are attributable to noise in the position data.)C, SWS. Note the large-amplitude irregular activity and occasional sharp waves in the EEG, corresponding, respectively, to periods of diffuse population activity and sudden increases in activity across the CA1 population. D, S-SIA emerging from a REM episode. Note the reduced-amplitude EEG and the unusual population activity profile, with a small percentage of continuously active cells and the rest nearly silent. During the two sharp waves, the population activity transiently increases. The transition into S-SIA is always quite abrupt and often follows one or two sharp waves.E, A later episode of S-SIA, this time occurring within LIA during SWS. Note that the same subset of cells is active as inD. F, An example of the transition into REM, which always evolves gradually out of LIA.
Fig. 2.
Fig. 2.
EEG and population activity structure of S-SIA.A, Population activity vector autocorrelation matrix from a 12 min sample of SWS, using 500 msec bins (from data set p108-03). Blue areas correspond to low correlation values and red areas correspond to high correlation values. The red blocks off the diagonal reveal highly consistent patterns of population activity occurring repeatedly throughout the 12 min time interval; these correspond to episodes of S-SIA.B, Scatterplot of sparseness versus EEG total power for each 2 sec epoch from the entire sleep period in data set p108-03. This data set exhibits a robust clustering corresponding to periods of LIA, REM, and S-SIA: LIA has high EEG power and high sparseness, REM has high EEG power and low sparseness, and S-SIA has low EEG power and low sparseness. Each point is color-coded according to the hand-delineated sleep state that occupies at least one-half of the 2 sec period that the point represents. C, D, Power spectra of hand-delineated sleep states. Power spectra were constructed using Welch's averaged, modified periodogram method, with a window size of 1 sec and a sampling frequency of 492.2 Hz. Only episodes at least 2 sec long were included in this analysis, totaling 1615.3 sec of S-SIA, 1293.9 sec of REM, and 5749.9 sec of LIA. S-SIA has a lower power across the frequency spectrum than either LIA or REM. It has a small peak in the low-frequency (type 2) theta range (∼6 Hz). REM shows a peak at type 1 theta frequency (∼7 Hz), and LIA has a wide peak at ∼2–4 Hz and remains higher than REM and S-SIA across the spectrum.D, The same data are plotted against log power to reveal the power differences in the high frequencies. Again, S-SIA has a lower power than LIA throughout the spectrum. REM has another peak around gamma frequency (35–90 Hz), which does not occur in LIA or S-SIA. The source of the peak near 90–95 Hz in all spectra is unknown. The sharp peaks at 60, 180, and 195 Hz are attributable to artifact.
Fig. 3.
Fig. 3.
EEG and population activity structure of S-SIA. A, B, Changes in mean population activity associated with S-SIA. Peri-event time histograms were constructed for 5 sec windows around S-SIA onsets and offsets. The average firing rate of the population of recorded cells was calculated by dividing the total number of spikes across the population in each 500 msec bin by the total number of cells in the population. Only episodes lasting >3 sec were used in this analysis to ensure that any structure emerging in the 3 sec after S-SIA onset and before S-SIA offset reflected actual population activity changes within episodes rather than an artifact of averaging episodes of varying lengths.A, Peri-event time histogram of population activity aligned at S-SIA onset. The mean population activity increases slightly at the onset of S-SIA episodes, a combined effect of the increase in activity across the entire population associated with the one or more sharp waves that often precede S-SIA episodes and the sudden burst of activity from the few S-SIA-active cells. The mean population activity then decreases into the S-SIA episode as the S-SIA-inactive cells become nearly silent and the S-SIA-active cells gradually decrease their activity (F = 9.512; p < 10−15). B, Peri-event time histogram of population activity aligned at S-SIA offset. The total population activity decreases as the activity of the S-SIA-active cells declines in the last few seconds of S-SIA and increases transiently just after S-SIA offset because sharp waves often terminate S-SIA episodes (F = 11.2; p < 10−15). C, D, Sparseness = <r>2/<r2>, where r is the vector of mean firing rates of the cells, using 500 msec time bins. C, Sparseness in hand-delineated LIA, REM, and S-SIA episodes. The mean sparseness during S-SIA is significantly smaller than during LIA but is not significantly different from REM (F = 11.17;p = 0.0048). D, Sparseness in correlation-delineated sleep states (S-SIA and non-S-SIA). The mean sparseness during S-SIA is significantly smaller than during non-S-SIA (p = 0.0059). E,F, EEG total power is the root-mean-square area under the curve of the EEG, using 492.2 samples/sec. E, EEG total power in hand-delineated LIA, REM, and S-SIA episodes, normalized by the total power in LIA in each data set. The mean total power in the EEG is significantly smaller in S-SIA than both REM and LIA (F = 19.63; p = 0.0008).F, EEG total power in correlation-delineated sleep states (non-S-SIA and S-SIA), normalized by the total power in non-S-SIA. The mean total power in the EEG is significantly smaller in S-SIA than in non-S-SIA (p = 0.0049). Thehorizontal dashed lines at EEG Power = 1 represent the normalized power during LIA (E) and non-S-SIA.
Fig. 4.
Fig. 4.
Temporal structure of S-SIA episodes.A, Correlation of population activity with the mean S-SIA population activity vector in 500 msec bins during a 10 min interval of LIA from data set p108-03, showing the detailed structure of S-SIA episode occurrence. Periods of high correlation generally correspond to S-SIA episodes. Note that S-SIA is irregularly intermixed with LIA during periods of SWS. B, Histogram of S-SIA episode durations. The mean duration is 7.9 ± 0.55 sec, but shorter episodes are more frequent than long ones. Longer S-SIA episodes are interrupted every few seconds by sharp waves and could also have been counted as a sequence of short episodes.C, Histogram of inter-S-SIA episode intervals. The mean is 36.9 ± 3.42 sec, and its distribution is also positively skewed.
Fig. 5.
Fig. 5.
Incidence of S-SIA relative to REM, based on 24 REM episodes and 194 S-SIA episodes from four animals.A, Cross-correlation of hand-delineated S-SIA offsets versus REM onsets. The dip before and at 0 represents the observation that S-SIA episodes never occur just before REM episodes.B, Cross-correlation of hand-delineated REM offsets versus S-SIA onsets. The peak at 0 represents the observation that REM offsets frequently correspond to S-SIA onsets (i.e., that most REM episodes are immediately followed by an S-SIA episode).C, Mean correlation of population activity with S-SIA in 5 sec bins for 1 min preceding each REM episode. On average, the correlation decreases significantly over time (F = 2.509; p = 0.0038), demonstrating that the incidence of S-SIA, as determined by population activity correlations, decreases over time before REM episodes. D, Mean correlation of population activity with S-SIA in 2 sec bins for 30 sec after each REM episode. The peak just at REM offset and rapid decline in correlation with S-SIA (F = 14.3;p < 10−15) demonstrate that REM episodes are often immediately followed by S-SIA episodes.
Fig. 6.
Fig. 6.
The population activity in S-SIA may reflect the rat's current location. A, Two short S-SIA episodes within LIA. Note the flattening of the EEG and the characteristic population activity. B, Later in the recording, the rat is awake and moving around inside the nest. Note that the same subset of cells that was active in S-SIA is active here.C–F, SIA-active cells change as the rat changes position in the nest (from p119-03). Same format as before, except now with two additional traces: the rat's x andy coordinates are plotted as a function of time, just below the EEG trace, so that changes in the rat's location within the nest can be seen along with the raster. C, S-SIA while the rat is in first location. Note the S-SIA-active cell. (This is the same period of time as Fig. 1E; another example of S-SIA from this recording can be seen in Fig.1D.) D, The rat enters S-SIA and then wakes up and changes its location inside the nest; note that a different cell becomes active in this new location. E, An S-SIA episode shortly after the change in location. Note that the same cell that was active while the rat was awake in the new location is active in S-SIA. F, A later S-SIA episode. While the rat is sleeping in this new location, this new cell continues to be S-SIA-active.
Fig. 7.
Fig. 7.
A, S-SIA population activity correlation maps. For each data set, the correlation between the S-SIA population activity vector and the mean population activity vector during run was plotted for each pixel of the environment. Blue areas correspond to low correlation values and red areas correspond to high correlation values (as shown by the scales to the right of each map). The peaks correspond to places in the environment where the population activity during run most closely resembles the population activity during S-SIA. The location of the sleeping nest within the environment is shown as ablack outline for each data set. The nest in p116-06 is rotated and shifted toward the left with respect to the nest in the other round environments, because the rat pushed it there early in the run session. The mean correlation in the nest was greater than expected by chance (p < 0.001), supporting the hypothesis that S-SIA-active cells tend to have place fields extending into the location in which the rat is sleeping. The mean inside-nest correlation values were also significantly higher than the mean outside-nest correlation values (F = 12.54;p = 0.016), demonstrating that the place fields of S-SIA-active cells are significantly more likely to be inside the nest than outside the nest. B, Two examples of cells that were not active during S-SIA but whose place fields in the run session extended into the nest. Black corresponds to areas in the environment where that cell had a high firing rate, andwhite corresponds to areas where that cell had a low firing rate (as shown by the scales to the right of each map); the black outline again corresponds to the location of the nest. The mean firing rate during S-SIA of cell 1009 (top) is 0.16 sec−1 and that of cell 1104 (bottom) is 0.36 sec−1; although these rates are toward the high end of S-SIA-inactive cells in this data set, they are significantly lower than those of the five cells that were clearly active during S-SIA in this data set (mean = 1.83 ± 0.63 sec−1; p = 0.002 and 0.0032, respectively). C, Mean firing rate of S-SIA-active and S-SIA-inactive cells outside and inside the nest during the run session. On average, cells that were S-SIA-active were more active inside the nest than outside the nest during run, and cells that were S-SIA-inactive were more active outside the nest than inside the nest during run. Paired one-tailed t tests confirmed that both of these differences were significant (p = 0.03 and 0.02, respectively), supporting the hypothesis that the hippocampal population activity during S-SIA reflects the rat's awareness of its current location in space.

Similar articles

Cited by

References

    1. Bergmann BM, Winter JB, Rosenberg RS, Rechtschaffen A. NREM sleep with low-voltage EEG in the rat. Sleep. 1987;10:1–11. - PubMed
    1. Buzsáki G. Hippocampal sharp waves: their origin and significance. Brain Res. 1986;298:242–252. - PubMed
    1. Buzsáki G, Horvath Z, Urioste R, Hetke J, Wise K. High-frequency network oscillation in the hippocampus. Science. 1992;256:1025–1027. - PubMed
    1. Dement W, Kleitman N. The relation of eye movements during sleep to dream activity: an objective method for the study of dreaming. J Exp Psychol. 1957a;53:339–346. - PubMed
    1. Dement W, Kleitman N. Cyclic variations in EEG during sleep and their relation to eye movements, body motility, and dreaming. Electroencephalogr Clin Neurophysiol. 1957b;9:673–690. - PubMed

Publication types

LinkOut - more resources