Clinical Trial
. 2002 Feb 15;22(4):1426-35.
doi: 10.1523/JNEUROSCI.22-04-01426.2002.

Patterns of hand motion during grasping and the influence of sensory guidance

Affiliations
Clinical Trial

Patterns of hand motion during grasping and the influence of sensory guidance

Marco Santello et al. J Neurosci. .

Abstract

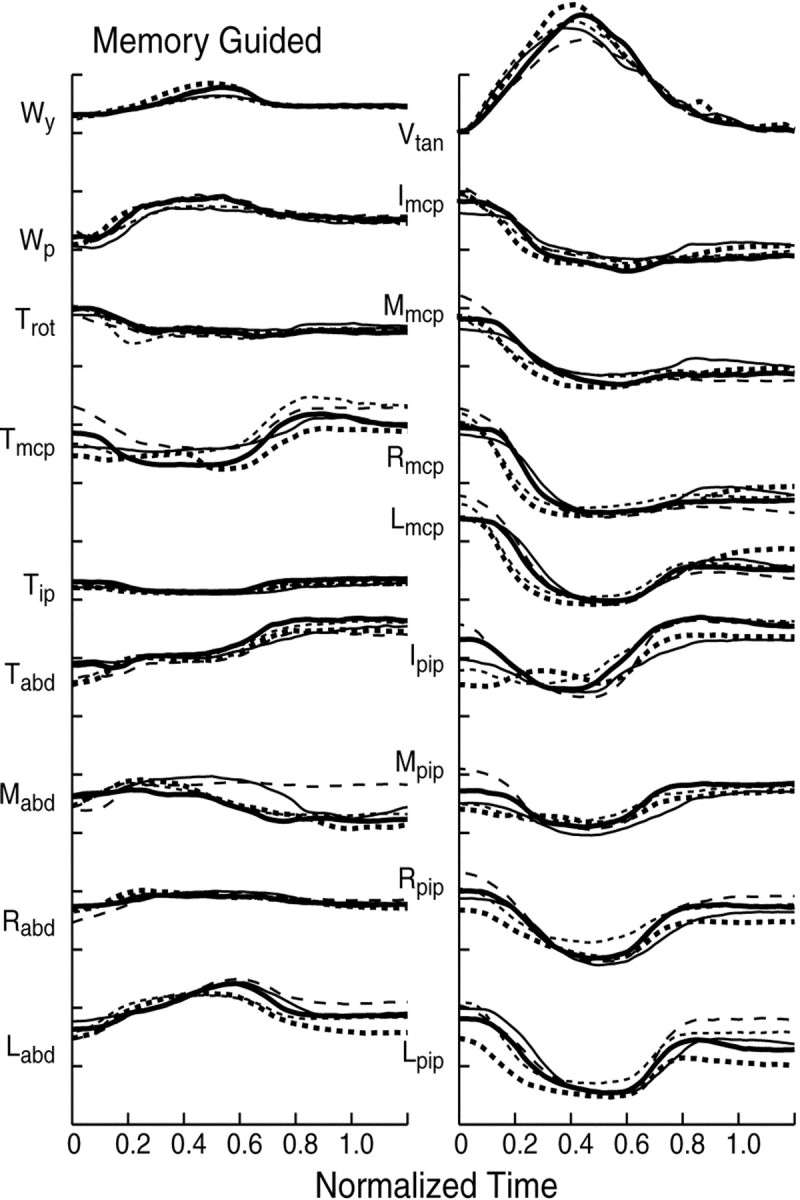
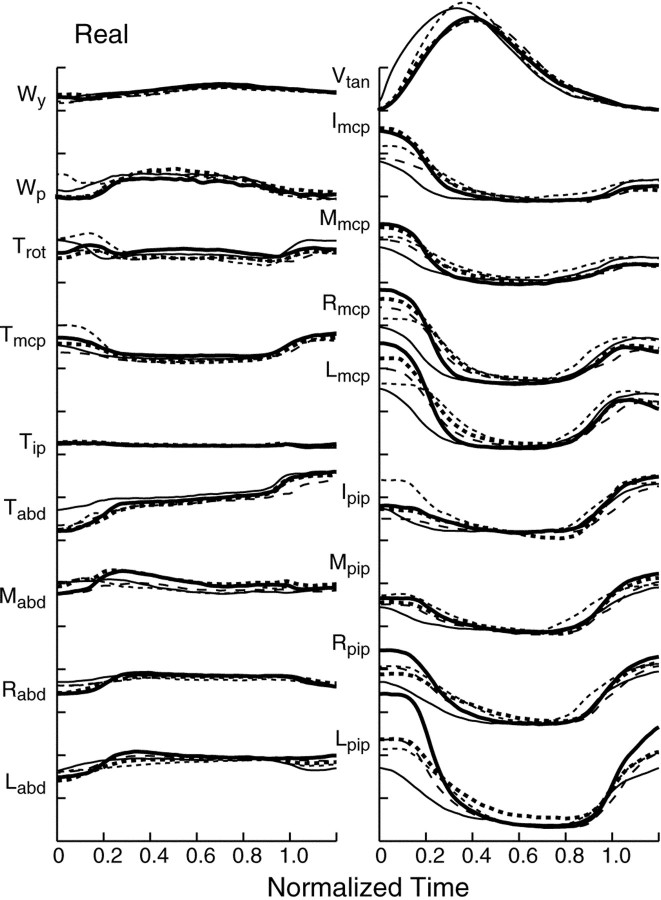
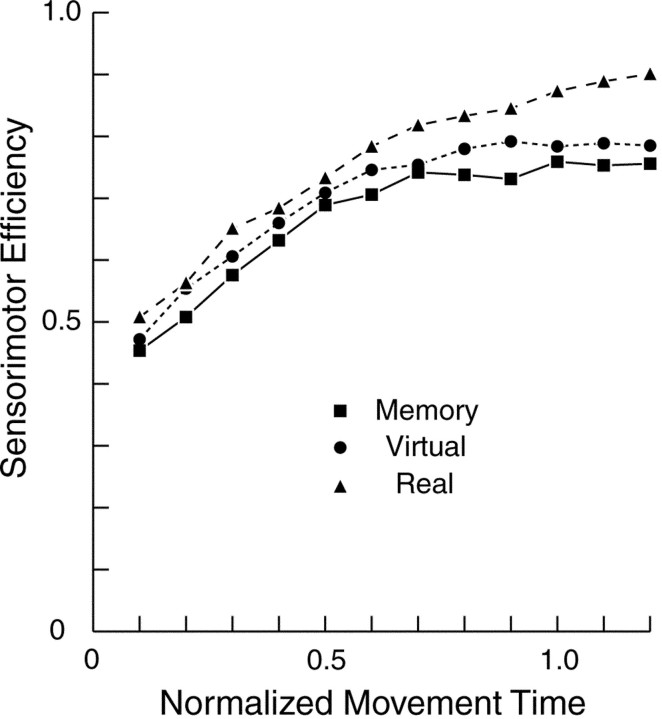
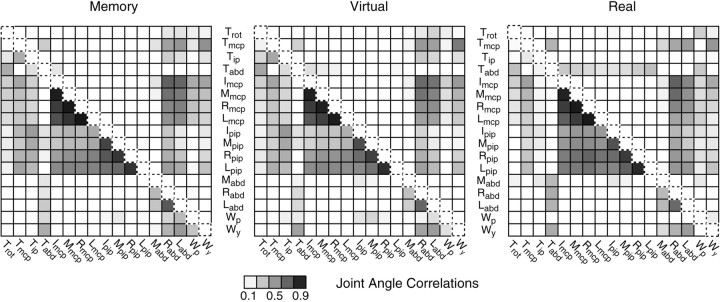
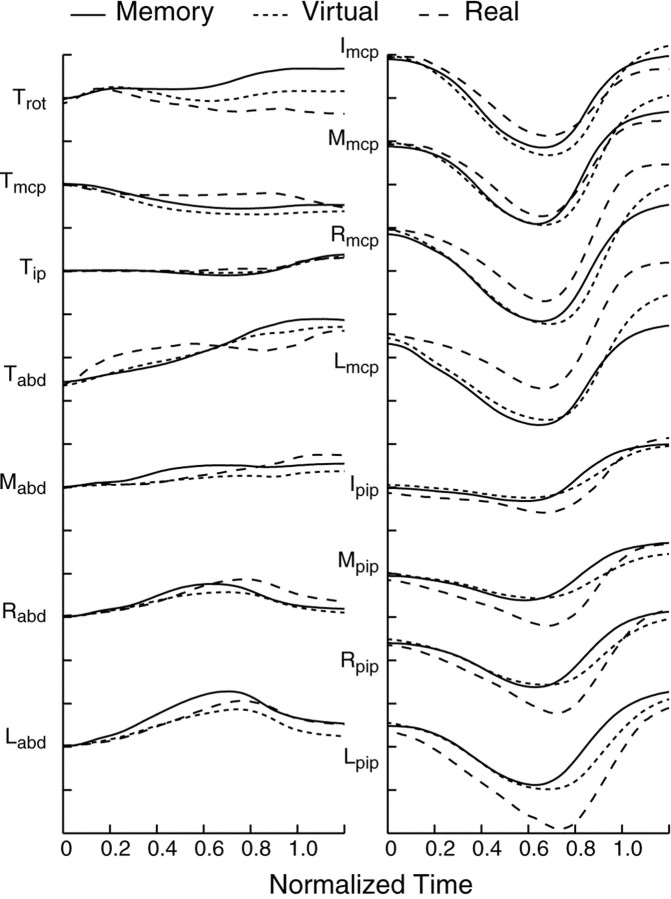
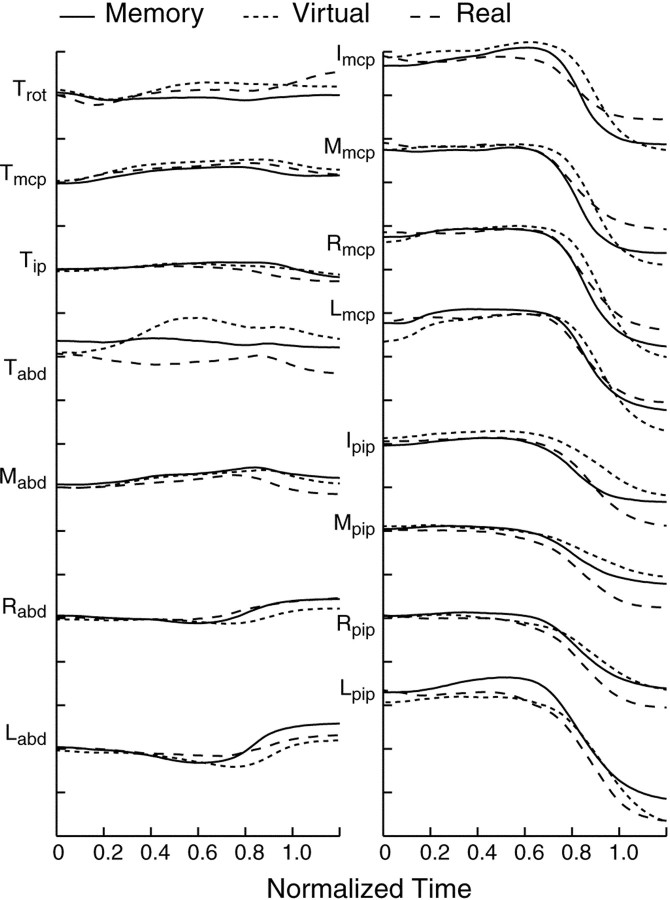
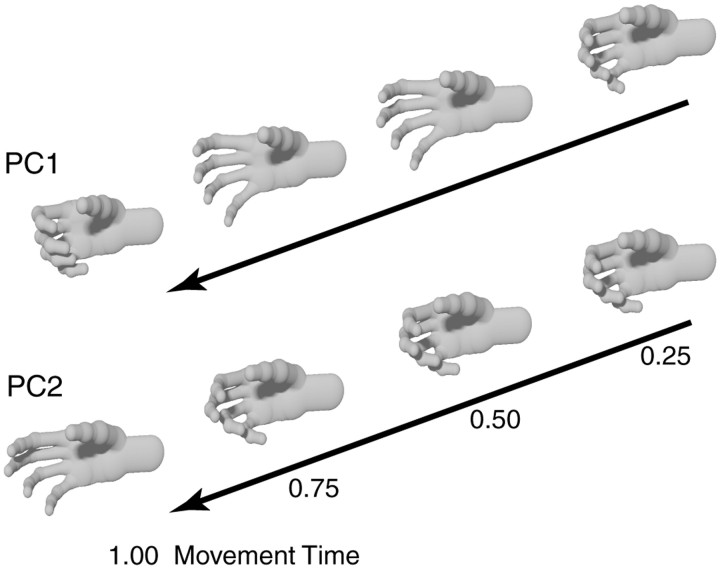
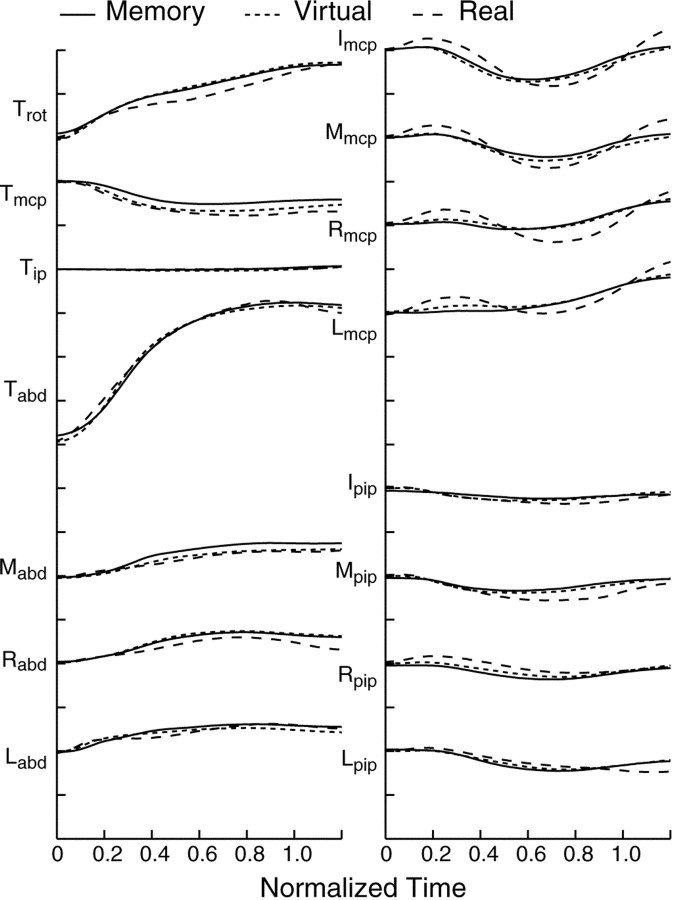
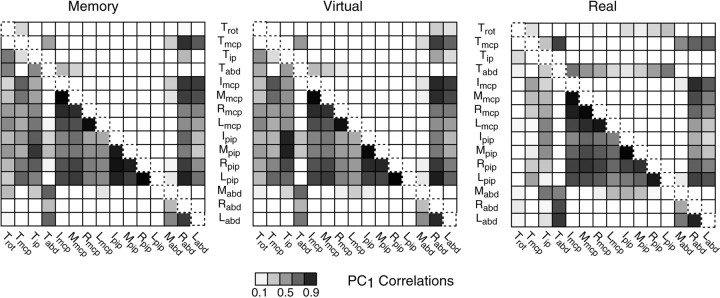
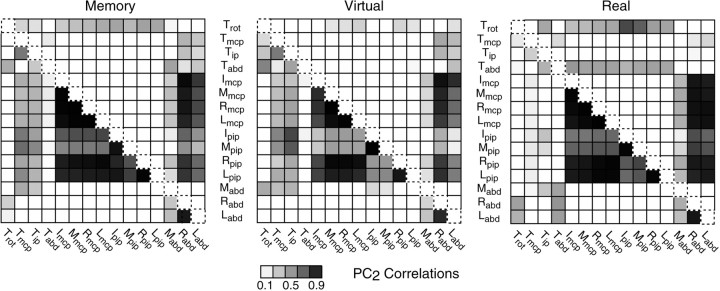
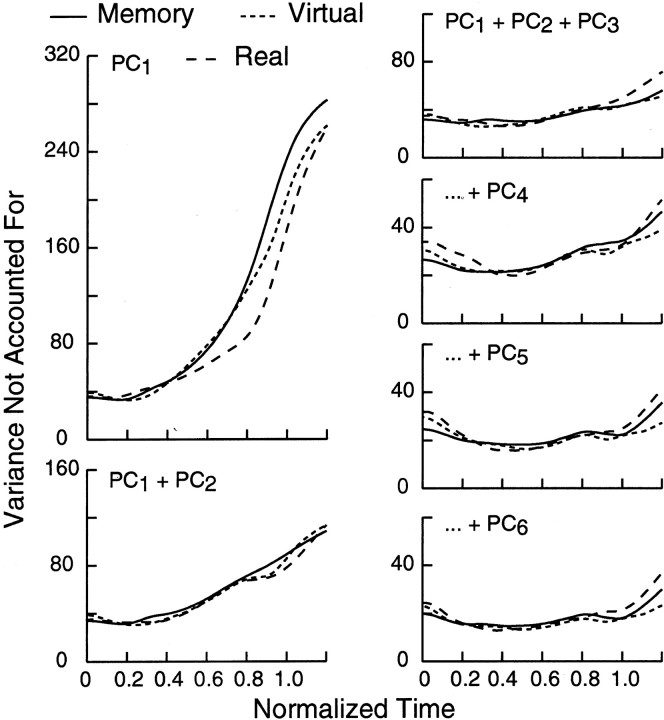
This study was aimed at describing temporal synergies of hand movement and determining the influence of sensory cues on the control of these synergies. Subjects were asked to reach to and grasp various objects under three experimental conditions: (1) memory-guided movements, in which the object was not in view during the movement; (2) virtual object, in which a virtual image of the object was in view but the object was not physically present; and (3) real object, in which the object was in view and physically present. Motion of the arm and of 15 degrees of freedom of the hand was recorded. A principal components analysis was developed to provide a concise description of the spatiotemporal patterns underlying the motion. Vision of the object during the reaching movement had no influence on the kinematics, and the effect of the physical presence of the object became manifest primarily after the fingers had contacted the object. Two principal components accounted for >75% of the variance. For both components, there was a strong positive correlation in the rotations of metacarpophalangeal and proximal interphalangeal joints of the fingers. The first principal component exhibited a pattern of finger extension reversing to flexion, whereas the second principal component became important only in the second half of the reaching movement.


Figures

Fig. 1.
Fig. 1.
Time course of motion of the hand during memory-guided reaching to one object (experiment 1). Thetraces depict data from five trials for one object (stapler). From top to bottom, thetraces in the left column depict the motion of the wrist [yaw (Wy) and pitch (Wp)], of the thumb [rotation (Trot), flexion at the mcp (Tmcp) and ip joints (Tip), and abduction (Tabd)], and the abduction angles between adjacent fingers: index–middle fingers (Mabd), middle–ring fingers (Rabd), and ring–little fingers (Labd). From top tobottom, the traces in the right column show the wrist tangential velocity (Vtan) and the angular excursion at mcp joints of the index (I), middle (M), ring (R), and little (L) fingers and at the pip joints. Positive values denote flexion and abduction. At the thumb, positive values denote internal rotation. The data are for one subject (S3). Time has been normalized from the onset to the end of the movement, both defined by the wrist tangential velocity (0 and 1). Scale: 25°/division.
Fig. 2.
Fig. 2.
Time course of motion of the hand during reaches to a real object. The traces depict data from five movements when the object (stapler) was physically present (experiment 3). Data are from the same subject (S3) and are shown in the same format as in Figure 1.
Fig. 3.
Fig. 3.
Information transmitted by hand shape in the three experimental conditions. The information transmitted defined as theSensorimotor Efficiency was computed at intervals of 10% of the normalized movement time. The data shown are averages from all subjects.
Fig. 4.
Fig. 4.
Correlation coefficients of the relations between joint angles of the hand. The gray scale in eachsquare denotes the correlation coefficient (r) for the relation between the angles indicated in the respective column and row. Correlation coefficients were computed from individual trials over the normalized movement time (0–1.2). Entries below the diagonal denote positive rvalues, whereas entries above the diagonal denote negative correlations. The values shown are averages of all trials from all subjects.
Fig. 5.
Fig. 5.
Time course of joint rotations: first principal component. The first principal component is shown for one subject (S1) and for each experimental condition. The scale is arbitrary, but it is the same for all joint angles. The layout is similar to that used in Figure 1.
Fig. 6.
Fig. 6.
Time course of joint rotations: second principal component. Data are from the same subject (S1) and are shown in the same format as in Figure 5 (see also Fig. 1).
Fig. 7.
Fig. 7.
Reconstruction of hand postures during the movement. In the top row, hand postures were derived by adding the first principal component (with a weighting factor of 15) to the average posture at movement onset. Postures in the second row were obtained by adding the second principal component (with a weighting factor of 10) to the starting posture. The data are from subject S1 for memory-guided movements. The weighting coefficients for individual trials for this subject ranged from −4.6 to 19.1 for PC1 and from −12.7 to 11.2 for PC2.
Fig. 8.
Fig. 8.
Time course of joint rotations: first principal component. The data are results from the one subject (S4) whose first principal component differed the most from the others. Note that the excursion in Tabd was much larger for this subject, but that the pattern of covariation of motion among the pip and mcp joints in this instance was similar to that depicted in Figure 5.
Fig. 9.
Fig. 9.
Correlation coefficients of the relations between the joint angle waveforms of the first principal component. The plots were constructed in the same manner as those in Figure 4, by computing the pairwise correlations (r) between joint angles over the interval 0–120% of normalized movement time. Results for the four subjects were averaged. The principal component axes from the virtual and real conditions were rotated to best align them with those for memory-guided movements.
Fig. 10.
Fig. 10.
Correlation coefficients of the relations between joint angle waveforms of the second principal component. Data are presented in the same format as in Figures 4 and 9.
Fig. 11.
Fig. 11.
Variance not accounted for by different sets of principal components. The variance not accounted for by different combinations of principal components was computed at each point of the normalized movement interval of 0–1.2. Results for PC1 alone and for the sum of PC1 and PC2 are shown in the left column. In the right column and from top tobottom, results are shown for the sum of the first three, four, five, and six PCs, respectively. Data are averages from all subjects. Note the change in scale in the last three panels. VNAC is reported in arbitrary units. The first three PCs accounted for 84% of the variance, on average. Thus, a VNAC equal to 40 corresponds to ∼15% of the variance.

References

    1. Batista AP, Buneo CA, Snyder LH, Andersen RA. Reach plans in eye-centered coordinates. Science. 1999;285:257–260. - PubMed
    1. Chieffi S, Gentilucci M. Coordination between the transport and the grasp components during prehension movements. Exp Brain Res. 1993;94:471–477. - PubMed
    1. Crossman ERFW, Goodeve PJ. Feedback control of hand-movement and Fitts' Law. Q J Exp Psychol A. 1983;35:251–278. - PubMed
    1. Desmurget M, Pélisson D, Rosetti Y, Prablanc C. From eye to hand: planning goal-directed movements. Neurosci Biobehav Rev. 1998;22:761–788. - PubMed
    1. Georgopoulos AP. On reaching. Annu Rev Neurosci. 1986;9:147–170. - PubMed

Publication types

LinkOut - more resources