. 2002 Feb 15;22(4):1480-95.
doi: 10.1523/JNEUROSCI.22-04-01480.2002.

Cortical focus drives widespread corticothalamic networks during spontaneous absence seizures in rats

Affiliations

Cortical focus drives widespread corticothalamic networks during spontaneous absence seizures in rats

Hanneke K M Meeren et al. J Neurosci. .

Abstract

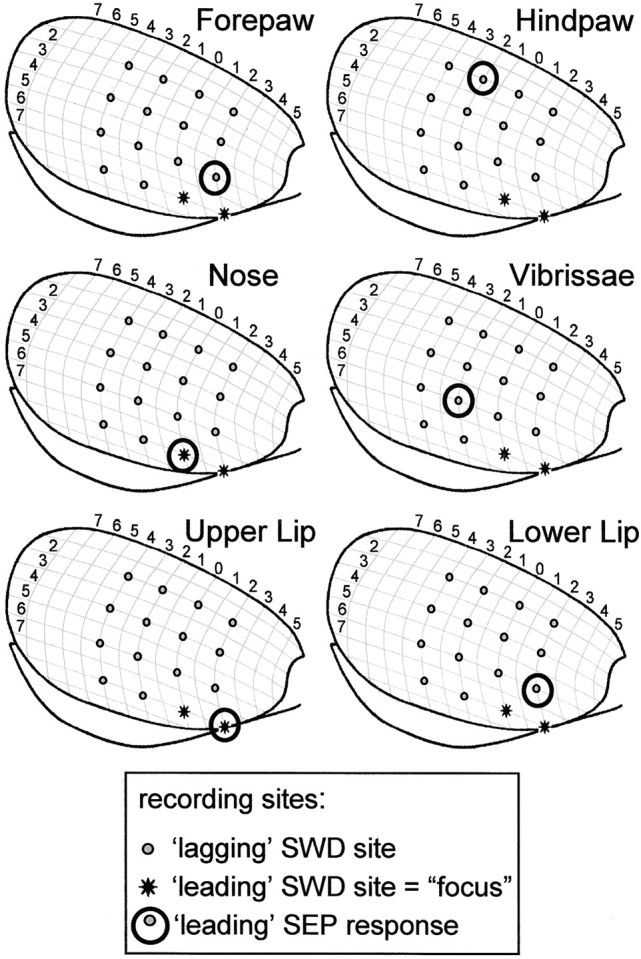
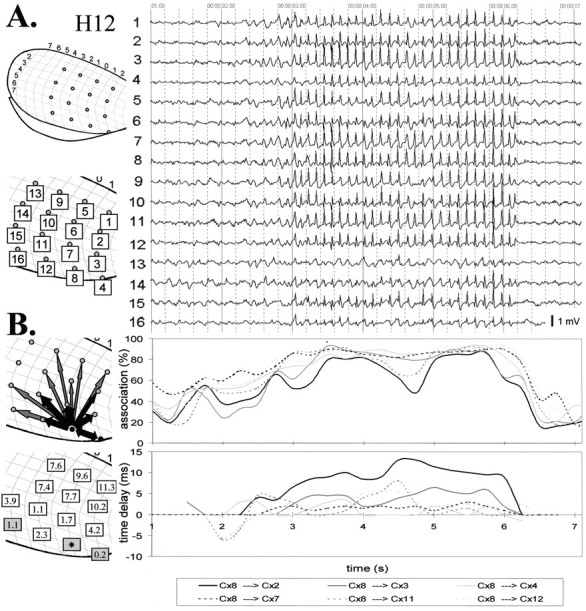
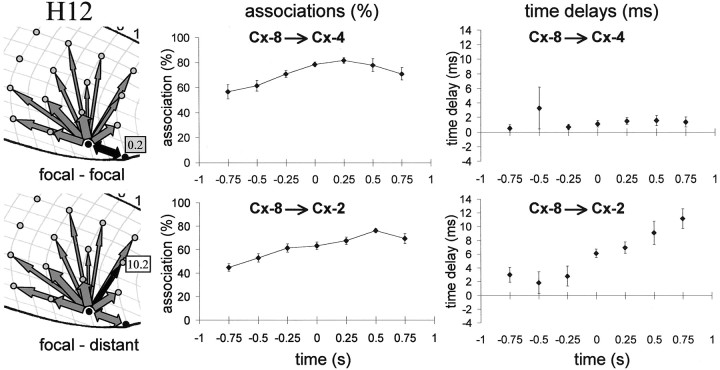
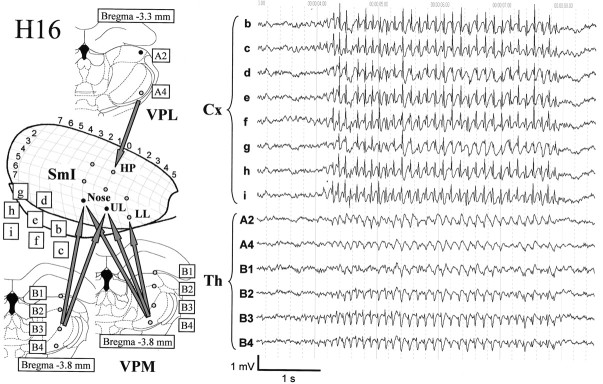
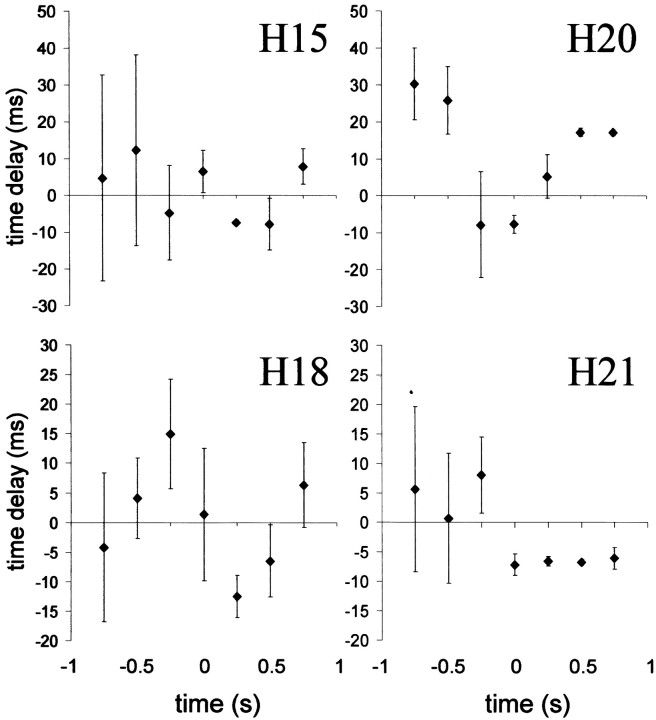
Absence seizures are the most pure form of generalized epilepsy. They are characterized in the electroencephalogram by widespread bilaterally synchronous spike-wave discharges (SWDs), which are the reflections of highly synchronized oscillations in thalamocortical networks. To reveal network mechanisms responsible for the initiation and generalization of the discharges, we studied the interrelationships between multisite cortical and thalamic field potentials recorded during spontaneous SWDs in the freely moving WAG/Rij rat, a genetic model of absence epilepsy. Nonlinear association analysis revealed a consistent cortical "focus" within the peri-oral region of the somatosensory cortex. The SWDs recorded at other cortical sites consistently lagged this focal site, with time delays that increased with electrode distance (corresponding to a mean propagation velocity of 1.4 m/sec). Intra-thalamic relationships were more complex and could not account for the observed cortical propagation pattern. Cortical and thalamic sites interacted bi-directionally, whereas the direction of this coupling could vary throughout one seizure. However, during the first 500 msec, the cortical focus was consistently found to lead the thalamus. These findings argue against the existence of one common subcortical pacemaker for the generation of generalized spike-wave discharges characteristic for absence seizures in the rat. Instead, the results suggest that a cortical focus is the dominant factor in initiating the paroxysmal oscillation within the corticothalamic loops, and that the large-scale synchronization is mediated by ways of an extremely fast intracortical spread of seizure activity. Analogous mechanisms may underlie the pathophysiology of human absence epilepsy.


Figures

Fig. 1.
Fig. 1.
Intra-hemispheric and inter-hemispheric corticocortical relationships. A, Typical example of an electrographic seizure recorded from bilaterally symmetrical cortical sites (rat H4). Negativity is up. B, Intra-hemispheric associations (%) as a function of electrode distance (mm). Each point in the graph represents the average strength of association for a given electrode pair over eight seizures. The relationships can be described by astraight line and are identical for the left and right hemisphere. C, Intra-hemispheric time delays (ms) as a function of electrode distance (mm). Each point in the graph represents the average time lag (ms) for a given electrode pair over eight seizures. Data of electrode 1–12 are taken into account. The relationships can be described by a straight lineand are similar for the left (CxL) and right (CxR) hemisphere, resulting in an average propagation velocity of 1 m/sec. D, Intra-hemispheric versus inter-hemispheric association. The average associations over eight seizures for electrode pairs with an inter-electrode distance of 6 mm are used to calculate the associations within one hemisphere (= intra-hemispheric association; mean and SEM; n = 6 electrode pairs, 3 pairs in each hemisphere) and between the homologous points of the two hemispheres (= inter-hemispheric association; mean and SEM; n = 6 electrode pairs). The inter-hemispheric association is twice as high as the intra-hemispheric association (p < 0.005; two-tailedt test; df = 10). (For B,C, and D, data of electrodes 1–12 are taken into account).
Fig. 2.
Fig. 2.
Intra-hemispheric corticocortical relationships.A, A typical electrographic seizure recorded with a cortical grid that covers a great part of the lateral convexity of the neocortex (rat H12). The position of the electrodes and their labels are shown on the left. The generalized nature of the discharges can be readily recognized. B, Topographical arrow representations of the results of the nonlinear association analysis (averaged over 10 seizures) from five different perspectives. The thickness of thearrow represents the strength of the association, and the direction of the arrowhead points to the direction of the lagging site. Electrodes 4 and 8 (black dots) were found to consistently lead the other sites across seizures. The numbers depict the average time delays (in milliseconds) over 10 seizures with respect to electrode 8.C, The association (left) and time delay (middle and right) as a function of electrode distance (mm). Each point in the graphs represents the average association (%) or average time lag (ms) for a given electrode pair over 10 seizures. The linear regression lines and their corresponding equations are also plotted. When all possible electrode pairs are taken into account, the relationship between time delay and distance is weak (middle). When only the time delays with respect to the focal site of electrode 8 are considered, this relationship is quite strong (left) and corresponds to an average propagation velocity of 2 m/sec.
Fig. 3.
Fig. 3.
Topography of the cortical focus. These are the pooled results from eight rats with cortical grids. The positions of the recording sites are indicated by the position of the symbols, with a different symbol for each individual rat. Filled symbols represent the leading sites as established by nonlinear association analysis; open symbols represent the lagging sites. The focus is found almost exclusively at the most ventrolateral recording sites. The foci of different animals overlap for a great part.
Fig. 4.
Fig. 4.
Functional topography of the focus. The leading sites of the somatosensory evoked potentials (SEPs) (circles) for different peripheral mechanical stimulations are shown for rat H12. The focal sites for SWDs (asterisk) correspond to the leading SEP sites for stimulation of the upper lip and nose. The results for the other seven animals can be found in Table 1.
Fig. 5.
Fig. 5.
Time evolution of the intra-hemispheric corticocortical relationships. A, A typical electrographic seizure recorded (with negativity up) with a cortical grid that covers a great part of the lateral convexity of the neocortex (rat H12). The position of the electrodes and their labels are shown on the left. B, Time courses of the corticocortical nonlinear associations (top panel) and time delays (bottom panel) for several sites (as indicated by theblack arrows on the left) with respect to the focal site (electrode 8). The association and time delays were assessed for successive 50% overlapping 500 msec epochs. For comparison the pictures on the left depict the average overall associations (top) and the average overall time delays (bottom; in milliseconds), as in Figure 2. There is a gradual increase in association strength before the start of the seizure and a steep drop in association strength at the end. Before the seizure, time delays are inconsistent, and there is often a zero time lag. During the seizure, time delays are always in the same direction, although the magnitude of the delay can vary.
Fig. 6.
Fig. 6.
Average corticocortical relationships during the transition period. The average (of 8 seizures) association (in %;middle) and time delay (in milliseconds;right) with SEMs (vertical bars) for two different sites (indicated by the black arrows on theleft) with respect to the focal site (Cx-8) are plotted for successive 50% overlapping 500 msec epochs. Values belonging to a given epoch are plotted at the mid time point of the corresponding epoch (for example, values plotted at t = 0.5 are derived from the 250–750 msec epoch). t = 0 denotes the onset of the generalized seizure (= peak of the first generalized spike). For both sites there is a gradual increase in association strength. The time delay between the two focal sites (Cx-8 andCx-4; top) does not differ significantly from zero. The time delay of a relatively distant site (Cx-2; bottom; with an average overall time delay of 10.2 msec; left) starts to differ significantly from zero with respect to the focal site during the transition epoch (−250 to +250 msec) and increases in value during the first second of the seizure.
Fig. 7.
Fig. 7.
Typical example of an electrographic seizure (with negativity up) from simultaneously recorded cortical and thalamic leads in rat H16. The schematic drawing at the left depicts the position of the electrodes on the cortex (Cx) (SmI, primary somatosensory cortex; HP, hindpaw area; UL, upper lip area; LL, lower lip area; established with somatosensory evoked potentials) and the thalamus (Th) (VPL, ventroposterior lateral nucleus; VPM, ventroposterior medial nucleus), with their respective labels. The arrows indicate which cortical and thalamic sites are interconnected as established by histology, electrical stimulation of the thalamic sites, and somatosensory evoked potentials. In the field potentials from the VPM (bottom two traces: B3,B4), a typical spike-wave morphology can be seen, with a highly sharp but often small negative spike appearing on the decreasing slope of the negative wave. In contrast, the signals from the VPL (A4) and the LD (A2) show a much more (sharp or arched) spindle-like pattern. In the two cortical focal sites (i, f) and the two sites anterior from these (b, c), some rhythmic activity can be seen preceding the onset of the generalized seizure. The same is observed in the two VPM traces.
Fig. 8.
Fig. 8.
Thalamocortical relationships in rat H16.A, Distribution of the overall thalamocortical time delays (= time delay when whole seizure is analyzed as one epoch) for individual seizures (n = 10) for the combinations of cortical and thalamic sites, which were shown to be interconnected as indicated by the black and grayarrows in the schematic drawing on theright. The time delays τ (in milliseconds) are bimodally distributed with both positive and negative delays, corresponding to either thalamus “leading” orcortex “leading.”B, Thalamocortical association strengths and time delays for the 500 msec epochs during the transition to a seizure for the electrode pair with a cortical focus (Th-B4 and Cx-f), indicated by the black arrow in the schematic drawing underA. The left panel shows theh2(τ) plots (association as a function of time delay) for three successive 50% overlapping epochs during a single seizure. Time point 0 indicates the onset of the seizure (appearance of the first generalized spike). During the first 500 msec of the seizure, the h2(τ) plot is characterized by a clear maximum at a negative time delay, indicating that the cortex is leading. In the successive epochs, a maximum at a positive time delay, corresponding to thalamus leading, appears. During the second 500 msec of the seizure the latter maximum has become larger than the former maximum. The right panel shows the time evolution of the average association parameters over seizures (mean ± SEM; n = 10 seizures) during the transition phase. Values belonging to a given epoch are plotted at the mid time point of the corresponding epoch (for example, values plotted at t = 0.5 are derived from the 250–750 msec epoch). A steady rise in the strength of association can be noticed at the top. At thebottom, before onset of the seizure there is a large variation in time delay. During the first 500 msec of the seizure, however (time point 0.25 sec; epoch 0–500 msec), this variation decreases to almost zero, resulting in a significant negative time delay, which signifies that the cortex consistently leads the thalamus. After this first seizure epoch the variation in time delay increases again, resulting in values that do not differ significantly from zero.
Fig. 9.
Fig. 9.
Thalamocortical time delays (mean ± SEM;n = 8–10 seizures) for successive 50% overlapping 500 msec epochs for a cortical focus site in four other rats. Before onset of the seizure there is usually a large variation, and time delays do not differ significantly from zero. In all animals, however, this variation decreases at the start of the seizure, resulting in a significant negative time delay, corresponding to consistent leading by the cortex. In rats H15, H16 (Fig. 8), and H18, this occurs for the 0–500 msec epoch; in rats H20 and H19, this occurs for the −250 to +250 msec epoch. After this initial seizure epoch, consistency across animals (or across electrode combinations) is lost. Time delays do not differ significantly from zero in rats H15, H16 (Fig. 8), and H18, whereas in rat H20 the thalamus consistently starts to lead and in H21 the cortex continues to lead.
Fig. 10.
Fig. 10.
Summary of the corticocortical (represented by the black arrows), intra-thalamic (light gray arrows), and corticothalamic (dark gray arrows) interdependencies during spontaneous absence seizures in the WAG/Rij rat as established by the nonlinear association analysis (values for associations and time delays are derived from rat H16 and can be found in detail in Table 2). The thickness of thearrow represents the average strength of the association, and the direction of thearrowhead points to the direction of the lagging site. The values represent the corresponding average time delays in milliseconds. For this rat, 10 seizures were analyzed.A, The relationships as found for the first 500 msec of the generalized seizure. A consistent cortical focus was found in the upper lip and nose area of the somatosensory cortex (SmI), because this site consistently led the other cortical recording sites. The hindpaw area, for instance, was found to lag by 2.9 msec on average with respect to this focal site. Within the thalamus, the laterodorsal (LD) nucleus was found to consistently lead other thalamic sites. The ventroposterior medial (VPM) nucleus was found to lag behind the ventroposterior lateral (VPL) nucleus, with an average time delay of 4.3 msec. Concerning corticothalamic interrelationships, the cortical focus site consistently led the thalamus (VPM), with an average time delay of 8.1 msec. Within the somatosensory system of the hindpaw, the (nonfocal) cortical site led the thalamic site (VPL) during 3 of 10 seizures; the thalamus led the cortex during 1 seizure, whereas for the other 6 seizures no direction of the delay could be established.B, The relationships as found when the whole seizure is analyzed as one epoch. The same cortical focus as during the first 500 msec was found consistently. Compared with the first 500 msec, the time delay from the cortical focus with respect to the nonfocal cortical sites has increased. Furthermore, the strength of association between VPL and VPM has increased. The direction of the corticothalamic couplings has changed. For the nonfocal cortical sites, the thalamus was found to lead during all seizures. For the focal cortical site, the cortex was found to lead during two seizures, whereas the thalamus was found to lead during seven seizures.

References

    1. Avanzini G, Panzica F, De Curtis M. The role of the thalamus in vigilance, epileptogenic mechanisms. Clin Neurophysiol. 2000;111[Suppl 2]:S19–S26. - PubMed
    1. Avoli M, Gloor P, Kostopoulos G, Gotman J. An analysis of penicillin-induced generalized spike and wave discharges using simultaneous recordings of cortical and thalamic single neurons. J Neurophysiol. 1983;50:819–837. - PubMed
    1. Buzsáki G. The thalamic clock: emergent network properties. Neuroscience. 1991;41:351–364. - PubMed
    1. Castro-Alamancos MA, Connors BW. Spatiotemporal properties of short-term plasticity in sensorimotor thalamocortical pathways of the rat. J Neurosci. 1996;16:2767–2779. - PMC - PubMed
    1. Chapin JK, Lin CS. Mapping the body representation in the SI cortex of anesthetized and awake rats. J Comp Neurol. 1984;229:199–213. - PubMed

Publication types

MeSH terms