. 2002 Feb 15;539(Pt 1):93-106.
doi: 10.1113/jphysiol.2001.012826.

Effects of inhibitors of the lipo-oxygenase family of enzymes on the store-operated calcium current I(CRAC) in rat basophilic leukaemia cells

Affiliations

Effects of inhibitors of the lipo-oxygenase family of enzymes on the store-operated calcium current I(CRAC) in rat basophilic leukaemia cells

Maike D Glitsch et al. J Physiol. .

Abstract

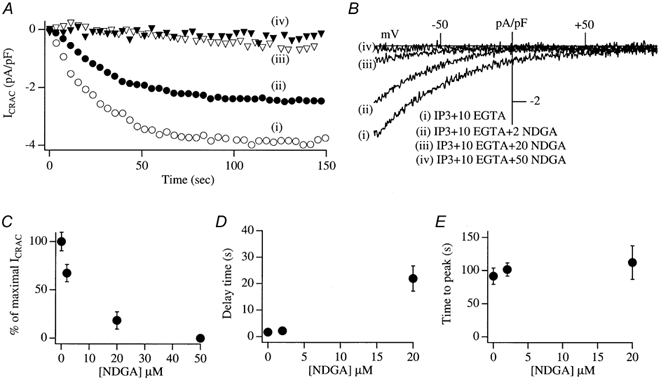
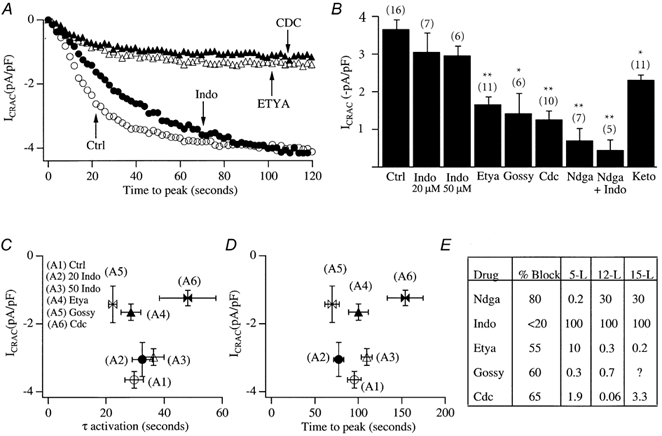
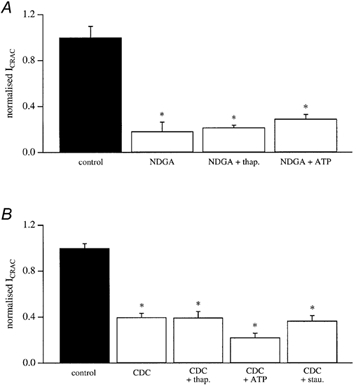
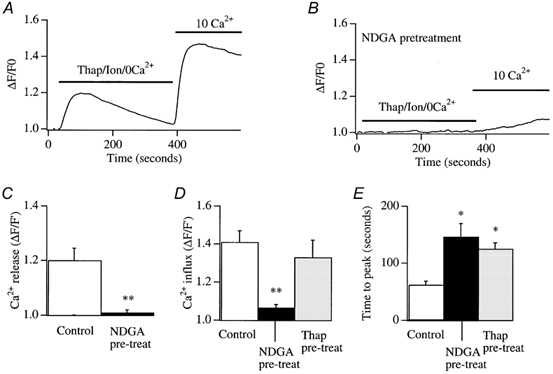
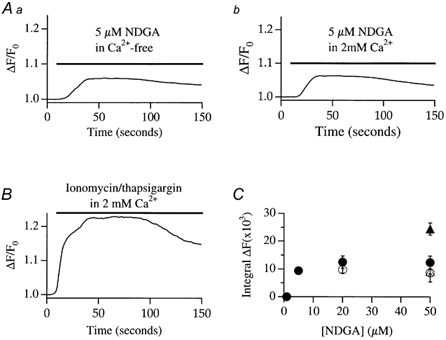
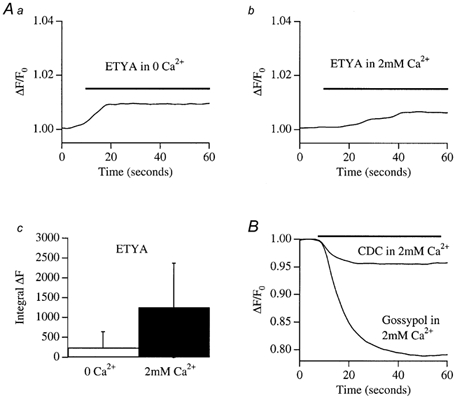
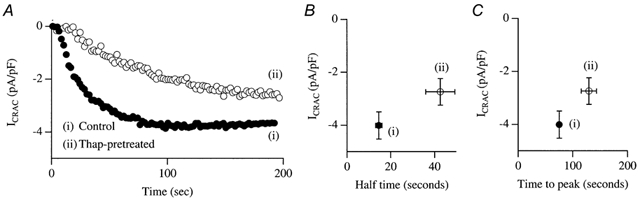
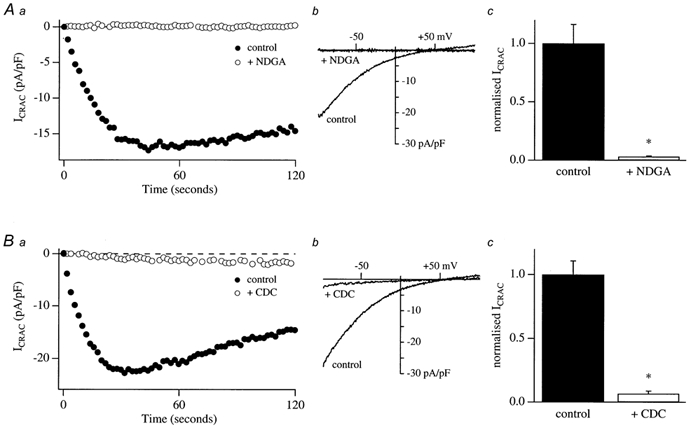
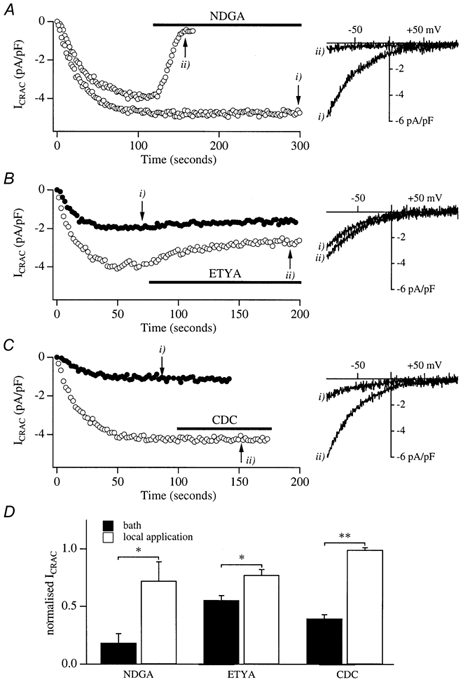
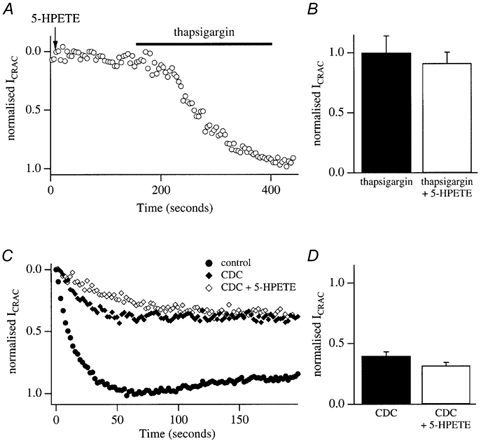
In non-excitable cells, the major Ca2+ entry pathway is the store-operated pathway in which emptying of intracellular Ca2+ stores activates Ca2+ channels in the plasma membrane. In many cell types, store-operated influx gives rise to a Ca2+-selective current called I(CRAC) (Ca2+ release-activated Ca2+ current). Using both the whole-cell patch clamp technique to measure I(CRAC) directly and fluorescent Ca2+ imaging, we have examined the role of the lipo-oxygenase pathway in the activation of store-operated Ca2+ entry in the RBL-1 rat basophilic leukaemia cell-line. Pretreatment with a variety of structurally distinct lipo-oxygenase inhibitors all reduced the extent of I(CRAC), whereas inhibition of the cyclo-oxygenase enzymes was without effect. The inhibition was still seen in the presence of the broad protein kinase blocker staurosporine, or when Na+ was used as the charge carrier through CRAC channels. The lipo-oxygenase blockers released Ca2+ from intracellular stores but this was not associated with subsequent Ca2+ entry. Lipo-oxygenase blockers also reduced both the amount of Ca2+ that could subsequently be released by the combination of thapsigargin and ionomycin in Ca2+-free solution and the Ca2+ influx component that occurred when external Ca2+ was re-admitted. The inhibitors were much less effective if applied after I(CRAC) had been activated. This inhibition of I(CRAC) could not be rescued by dialysis with 5(S)-hydroxyperoxyeicosa-6E,8Z,11Z,14Z,tetraenoic acid (5-HPETE), the first product of the 5-lipo-oxygenase pathway. Our findings indicate that exposure to pharmacological tools that inhibit the lipo-oxygenase enzymes all decrease the extent of activation of the current. Our results raise the possibility that a lipo-oxygenase might be involved in the activation of I(CRAC). Alternative explanations are also discussed.


Figures

Figure 1
Figure 1. The lipo-oxygenase inhibitor NDGA interferes with the activity of ICRAC
A, the development of ICRAC (measured at −80 mV from the voltage ramps) in control conditions (trace i, open circles) and then following pre-incubation (> 15 min) with different concentrations of NDGA. B, I–V relationships taken when the currents had reached steady state (80–100 s). Stores were emptied by dialysis with InsP3+ 10 mm EGTA. C, the relationship between the concentration of NDGA and inhibition of ICRAC is shown. D, the delay before ICRAC activates versus concentration of NDGA. E, time to peak versus NDGA concentration. In this, and all subsequent figures, the data points are means ± s.e.m.
Figure 2
Figure 2. Structurally distinct lipo-oxygenase blockers all reduce the extent of ICRAC
A, the effect of various inhibitors on the activation of ICRAC. Ctrl (open circles) denotes control (0.1% DMSO-treated cells), Indo (filled circles) denotes indomethacin (50 μm). B, the histogram summarizes mean data from several cells. Gossy denotes gossypol, Keto denotes ketoconazole. 20 and 50 Indo represent 20 and 50 μm Indo, respectively. All inhibitors were tested at a concentration of 20 μm (except gossypol which was used at 5 μm), and pre-incubated for at least 15 min. *P < 0.05 and **P < 0.01. C, amplitude of ICRAC against activation time constant. D, amplitude of ICRAC against time to peak. E, table summarizing the percentage block of ICRAC for the various inhibitors together with reported IC50 values for the different lipo-oxygenases, taken from the literature. Data for Ndga are from Salari et al. (1984) and Hope et al. (1983); data for Indo are from Salari et al. (1984) and Shen & Winter (1977); data for Etya are from Salari et al. (1984), Taylor et al. (1985) and Bokoch & Reed, 1981; data for Gossy were from Hamasaki & Tai (1985); and data for Cdc were from Cho et al. (1991).
Figure 3
Figure 3. Lipo-oxygenase inhibition of ICRAC persists in the presence of thapsigargin, ATP and staurosporine
A, the size of ICRAC in control cells, in those pre-exposed to 20 μm NDGA, and then after either 2 mm Mg-ATP or 2 μm thapsigargin have been included in the pipette solution following pre-exposure to NDGA. B, the size of ICRAC in control cells, after exposure to 20 μm CDC, and then after inclusion of either Mg-ATP or thapsigargin in the pipette solution following CDC pretreatment. Also included are data taken from cells first exposed to staurosporine and then CDC. Note that CDC still reduces ICRAC even in the presence of the kinase blocker. Each bar is the mean of 4–7 cells.
Figure 4
Figure 4. NDGA reduces store-operated Ca2+ influx to thapsigargin and ionomycin
A, Ca2+ release by the combination of ionomycin (100 nm) and thapsigargin (2 μm) is followed by store-operated Ca2+ influx when external Ca2+ is readmitted. B, pretreatment with NDGA (> 20 min) abolishes Ca2+ release to ionomycin/thapsigargin and subsequent Ca2+ entry is substantially reduced. C, pooled data for the extent of Ca2+ release for control (i.e. where thapsigargin and ionomycin were applied) cells and for those pre-exposed to NDGA. D, the extent of store-operated Ca2+ entry for control cells and after pre-treatment with NDGA. Included in the bar chart are the results from cell pre-exposed to thapsigargin for 15 min, perfused with Ca2+-free solution, and then external Ca2+ was re-admitted (see text for details). E, the time to peak of the store-operated Ca2+ entry signal for the different conditions indicated. The Thap pre-treatment data are discussed in a later section.
Figure 5
Figure 5. NDGA releases Ca2+ in a concentration-dependent manner
Aa, the time course of Ca2+ release from a cell exposed to 5 μm NDGA. b depicts a similar experiment but now in the presence of external Ca2+. B, time course of the Ca2+ response in a cell in which stores were fully depleted (combination of ionomycin and thapsigargin) in the presence of external Ca2+. C, dose-response curve to NDGA in the absence (open circles) and presence (filled circles) of external Ca2+. Included in the graph are the responses to ionomycin+ thapsigargin in the absence (open triangle) and presence (filled triangle) of external Ca2+. These latter two points are included in the graph for comparative purposes, but the cells were not exposed to NDGA.
Figure 6
Figure 6. Effects of other lipo-oxygenase blockers on Ca2+ release
A, ETYA (20 μm) evoked a small Ca2+ increase both in the absence (a) and presence (b) of external Ca2+. The integrated signals were not significantly different (c). B, CDC and gossypol both caused a fall in the fluorescence ratio, due to a decrease in the 356 nm signal.
Figure 7
Figure 7. Pretreatment with thapsigargin does not prevent ICRAC from developing
A, recordings taken from a control cell and from a cell that had been exposed to 2 μm thapsigargin in 10 mm external Ca2+ for 20 min. B, size of ICRAC against half-time for control and thapsigargin-treated cells. C, size of the current against the time to peak for the two conditions.
Figure 8
Figure 8. Pretreatment with either NDGA or CDC suppresses the Na+ current through CRAC channels in divalent ion-free external solution
Aa, comparison of the time course of the monovalent Na+ current for a control cell and that for a cell which had been pre-incubated with 20 μm NDGA for around 15 min. b, the ramp I–V relationships are shown for the cells in a, taken at 60 s for both conditions. c, mean data from four control cells and four cells pre-exposed to NDGA. Ba, time course of a control cell and a cell pre-incubated with 20 μm CDC. b, corresponding ramp I–V. c, mean data from four control cells and four cells pre-exposed to CDC prior to break-in. Data have been normalized to the amplitude of the controls.
Figure 9
Figure 9. Effect of application of the lipo-oxygenase inhibitors after ICRAC had developed
A, the effects of applying 50 μm NDGA after ICRAC had developed in two cells. Ramp IV relations are shown on the right. B, the effects of applying ETYA either before (filled circles) or after (open circles) ICRAC had activated. C, comparison of the ability of CDC to interfere with ICRAC when applied before (filled circles) or after (open circles) ICRAC had activated. D, summary of the effects of the three inhibitors on ICRAC. The filled columns represent the inhibition seen when cells were pre-incubated with each drug and the open columns reflect the inhibition seen following exposure to each drug after ICRAC had developed. For cells pre-exposed to inhibitors, recordings were normalized to controls taken from the same preparations in the absence of inhibitors. For those experiments where drugs were applied after ICRAC had developed, the steady-state level in the presence of inhibitors was normalized to the peak amplitude reached before the inhibitors were applied. These latter currents were not significantly different from the controls used for normalizing the currents obtained following pretreatment with the lipo-oxygenase blockers. Each column represents the mean of 6–11 cells. In all cases, inhibition was significantly less if the drug was applied after store depletion than before.
Figure 10
Figure 10. Effects of 5-HPETE on ICRAC
A, representative whole-cell recording from a cell dialysed with 5-HPETE in 120 nm buffered Ca2+. ICRAC did not activate. After 180 s, thapsigargin was applied and ICRAC subsequently developed. B, size of ICRAC following thapsigargin application in control cells, and in those dialysed with 5-HPETE. There was no significant difference. C, control recording (filled circles), recording taken after pre-exposure to CDC (diamonds) and recording after pre-exposure to CDC but with 5-HPETE in the pipette solution. The recording pipette contained InsP3+ 10 mm EGTA. Data have been normalized to control recordings. D, pooled data indicating that the reduction in ICRAC amplitude following pretreatment with CDC cannot be rescued by inclusion of 5-HPETE in the pipette.

Similar articles

Cited by

References

    1. Alvarez J, Montero M, Garcia-Sancho J. Cytochrome P-450 may link intracellular Ca2+ stores with plasma membrane Ca2+ influx. Biochemical Journal. 1991;274:193–197. - PMC - PubMed
    1. Bakowski D, Glitsch MD, Parekh AB. An examination of the secretion-like coupling model for the activation of the Ca2+ release-activated Ca2+ current ICRAC in RBL-1 cells. Journal of Physiology. 2001;532:55–71. - PMC - PubMed
    1. Barowski D, Parekh AB. Monovalent cation permeability and Ca2+ block of the store-operated Ca2+ current ICRAC in rat basophilic leukemia cells. Pflügers Archiv. 2002 (in the Press) - PubMed
    1. Beaven MA, Rogers J, Moore JP, Hesketh TR, Smith GA, Metcalfe JC. The mechanism of the calcium signal and correlation with histamine release in 2H3 cells. Journal of Biological Chemistry. 1984;259:7129–7136. - PubMed
    1. Berridge MJ. Capacitative Ca2+ entry. Biochemical Journal. 1995;312:1–11. - PMC - PubMed

Publication types

MeSH terms

LinkOut - more resources