. 2002 Feb 15;539(Pt 1):295-308.
doi: 10.1113/jphysiol.2001.013117.

Rho and rho kinase modulation of barrier properties: cultured endothelial cells and intact microvessels of rats and mice

Affiliations

Rho and rho kinase modulation of barrier properties: cultured endothelial cells and intact microvessels of rats and mice

R H Adamson et al. J Physiol. .

Abstract

Previous experiments using cultured endothelial monolayers indicate that Rho-family small GTPases are involved in modulation of endothelial monolayer permeability by regulating assembly of the cellular actin filament scaffold, activity of myosin-based contractility and junctional distribution of the Ca2+-dependent endothelial cell adhesion molecule, VE-cadherin. We investigated these mechanisms using both cultured endothelial cells (from porcine pulmonary artery and mouse heart) and vascular endothelium in situ (mouse aorta, and individually perfused venular microvessels of mouse and rat mesentery). Exposure to Clostridium difficile toxin B (100 ng x ml(-1)) inactivated 50-90% of all endothelial Rho proteins within 60-90 min. This was accompanied by considerable reduction of actin filament stress fibres and junctional F-actin in cultured endothelial monolayers and in mouse aortic endothelium in situ. Also, VE-cadherin became discontinuous along endothelial junctions. Inhibition of Rho kinase with Y-27632 (30 microM) for 90-120 min induced F-actin reduction both in vitro and in situ but did not cause redistribution or reduction of VE-cadherin staining. Perfusion of microvessels with toxin B increased basal hydraulic permeability (L(p)) but did not attenuate the transient increase in L(p) of microvessels exposed to bradykinin. Perfusion of microvessels with Y-27632 (30 microM) for up to 100 min reduced basal L(p) but did not attenuate the permeability increase induced by platelet activating factor (PAF) or bradykinin. These results show that toxin B-mediated reduction of endothelial barrier properties is due to inactivation of small GTPases other than RhoA. Rho proteins as well as RhoA-mediated contractile mechanisms are not involved in bradykinin- or PAF-induced hyperpermeability of intact microvessels.


Figures

Figure 1
Figure 1. Toxin B-induced glucosylation of Rho proteins in MyEnd cells and PAECs
Cultured MyEnd cells and PAECs were treated for 30, 60 and 90 min with toxin B. Degree of in vivo glucosylation was determined by [14C]glucose incorporation in cell lysates incubated with 1 μg ml−1 toxin B and [14C]UDP-glucose and subjected to SDS-PAGE and phosphorimaging. Value of control cultures was set to 1. Data are means ±s.d. of two separate experiments.
Figure 2
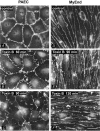
Figure 2. Toxin B reduces F-actin in PAECs and MyEnd cells
F-actin visualized by ALEXA-labelled phalloidin in cultured PAECs (A and B) and MyEnd cells (C and D) before (A and C) and after (B and D) 90 min exposure to 0.1 μg ml−1 toxin B. Note in B, toxin B-induced reduction of actin filament stress fibres which is more prominent in PAECs, as compared to MyEnd cells (D). Images shown are representative of eight separate experiments. Scale bar, 20 μm.
Figure 3
Figure 3. Effect of toxin B on distribution of VE-cadherin in cultured PAECs and MyEnd cells
PAECs (A-C) and MyEnd cells (D-F) were exposed to 100 ng ml−1 toxin B for the time intervals indicated. Note toxin B-induced redistribution and disruption of the junction-associated VE-cadherin immunostain accompanied by formation of intercellular gaps. PAECs respond more rapidly to toxin B with junctional dissociation than MyEnd cells. Images shown are representative of eight separate experiments. Scale bar, 20 μm.
Figure 4
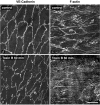
Figure 4. Effect of ROCK inhibition on F-actin and VE-cadherin in cultured MyEnd cells
Distributions of F-actin (A and B) and VE-cadherin (C and D) are shown from cultured MyEnd cells treated for 120 min with the ROCK inhibitor Y-27632 (30 mm). Note significant reduction of stress fibres but well preserved junction-associated actin filament system. The VE-cadherin distribution remains unchanged and no intercellular gaps are seen. Images shown are representative of eight separate experiments. Scale bar, 20 μm.
Figure 6
Figure 6. Effect of ROCK inhibition on F-actin and VE-cadherin on mouse endothelium in situ
Mouse aortas were perfused for 120 min in the absence (A and C) or presence (B and D) of Y-27632 (30 mm). VE-cadherin distribution is not affected by ROCK inhibition. Stress fibres were reduced by treatment with Y-27632 while peripheral band F-actin remained as in controls.
Figure 5
Figure 5. Effect of toxin B on mouse endothelium in situ
Distributions of VE-cadherin (A and B) and F-actin (C and D) are shown in mouse aortic endothelium after 60 min perfusion with control solution (A-C) or 60 min perfusion with toxin B (100 ng ml−1) (B-D). After exposure to toxin B VE-cadherin reveals numerous discontinuities in the perimeter label (single arrows in B) and frequent broad regions composed of numerous short spurs, some disconnected and some in intricate networks (double arrows in B). In control conditions the F-actin pattern, labelled with Oregon Green phalloidin, shows peripheral band (pb) and some stress fibres (sf) oriented parallel to the long axis of the cells (C). The intensity of F-actin labelling was diminished in both the peripheral band and the stress fibres in vessels perfused with toxin B (D). Images shown are representative of two in vivo experiments for each condition. Scale bar, 20 μm.
Figure 7
Figure 7. Toxin B increases Lp of venules in mouse mesentery
A, data from a representative experiment demonstrate that toxin B (100 ng ml−1) caused a large increase in Lp after about 1 h of perfusion. B, data from a control vessel, perfused with vehicle solution containing serum albumin (10 mg ml−1), show that mouse mesentery vessels are stable for over 2 h of perfusion.
Figure 8
Figure 8. Effect of toxin B on rat mesentery venules
A, data from a representative experiment show that Lp is stable for about 1 h before increasing by severalfold during exposure to toxin B. B, data from a control experiment demonstrate that the Lp of rat mesentery venules is stable during perfusion with vehicle solution containing serum albumin (10 mg ml−1) over a comparable 2 h period.
Figure 9
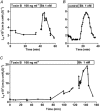
Figure 9. Toxin B does not block the acute inflammatory response to bradykinin in rat venules
A, Lp of a representative vessel is plotted during 35 min perfusion with toxin B (100 ng ml−1). When stimulated with bradykinin (1 nm) the vessel responds with a characteristic transient threefold increase in Lp. B, a representative response to bradykinin in the absence of toxin B is shown from a second vessel. C, a third vessel was perfused for nearly 2 h with toxin B (100 ng ml−1) at which time it showed an increased Lp, characteristic of the toxin effect. When exposed to bradykinin (1 nm) this vessel also responded with a transient increase in Lp.
Figure 10
Figure 10. Inhibition of ROCK reduces baseline Lp
Lp values, expressed as ratios to initial control period Lp (Lp,Y-27632/Lp,control), are shown versus time of exposure to Y-27632 (30 μm). The Lp of the treated group was significantly different from that of a second group perfused with vehicle control solution (P < 0.0001, two-way ANOVA).
Figure 11
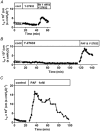
Figure 11. ROCK inhibition does not affect venule response to bradykinin or PAF
Data from representative experiments are shown as Lpversus time. A, after approximately 25 min pretreatment with Y-27632 (30 μm) a vessel responded characteristically to 1 nm bradykinin. A representative response to bradykinin in the absence of Y-27632 is shown in Fig. 9B. B, a vessel perfused for 100 min with Y-27632 (30 μm) responded typically to challenge with 1 nm PAF. C, a representative response to PAF in the absence of Y-27632 from a separate vessel.

References

    1. Aumailley M, Timpl R, Risau W. Differences in laminin fragment interactions of normal and transformed endothelial cells. Experimental Cell Research. 1991;196:177–183. - PubMed
    1. Busch C, Aktories K. Microbial toxins and the glycosylation of Rho family GTPases. Current Opinion in Structural Biology. 2000;10:528–535. - PubMed
    1. Carbajal JM, Gratrix ML, Yu CH, Schaeffer RC., Jr ROCK mediates thrombin's endothelial barrier dysfunction. American Journal of Physiology. 2000;279:C195–204. - PubMed
    1. Carbajal JM, Schaeffer RC., Jr RhoA inactivation enhances endothelial barrier function. American Journal of Physiology. 1999;277:C955–964. - PubMed
    1. Drenckhahn D, Ness W. The endothelial contractile cytoskeleton. In: Born GVR, Schwartz CJ, editors. Vascular Endothelium: Physiology, Pathology and Therapeutic Opportunities. Stuttgart: Schattauer; 1997. pp. 1–25.

Publication types

MeSH terms

LinkOut - more resources