. 2002 Feb 14;21(8):1272-84.
doi: 10.1038/sj.onc.1205183.

Oncogene cooperativity in Friend erythroleukemia: erythropoietin receptor activation by the env gene of SFFV leads to transcriptional upregulation of PU.1, independent of SFFV proviral insertion

Affiliations

Oncogene cooperativity in Friend erythroleukemia: erythropoietin receptor activation by the env gene of SFFV leads to transcriptional upregulation of PU.1, independent of SFFV proviral insertion

Iva Afrikanova et al. Oncogene. .

Abstract

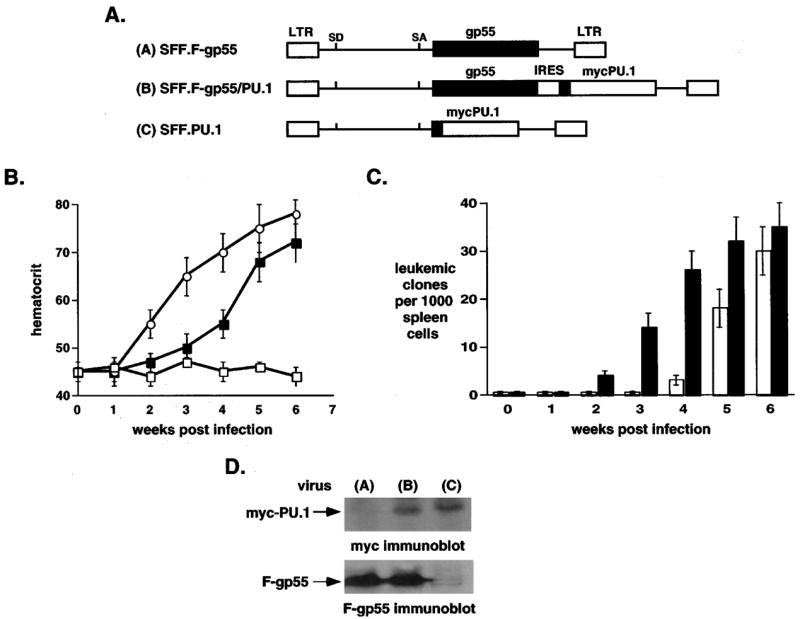
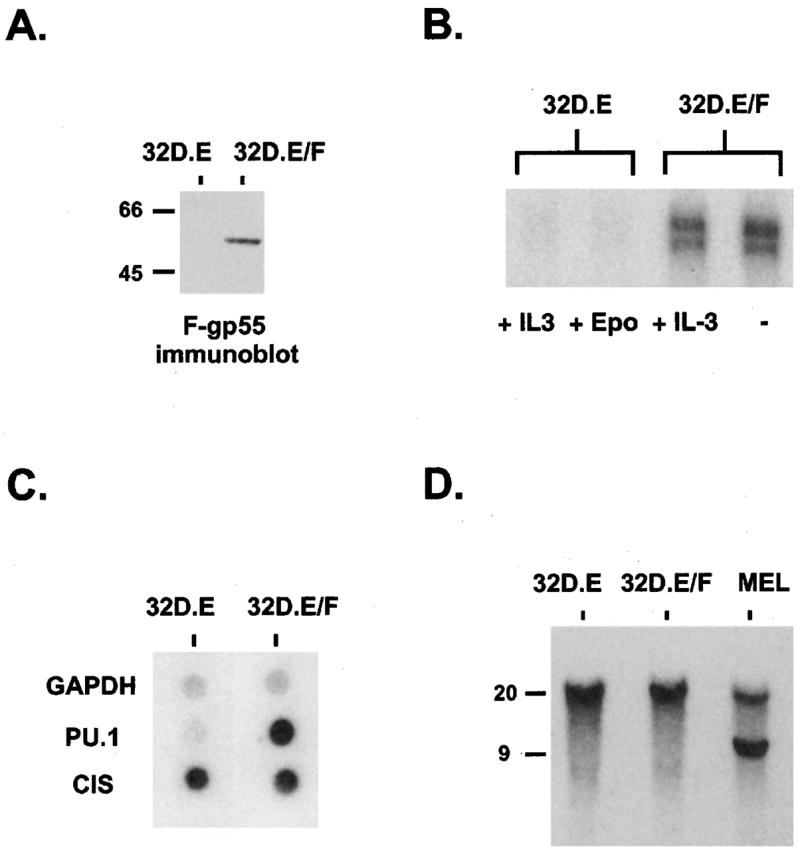
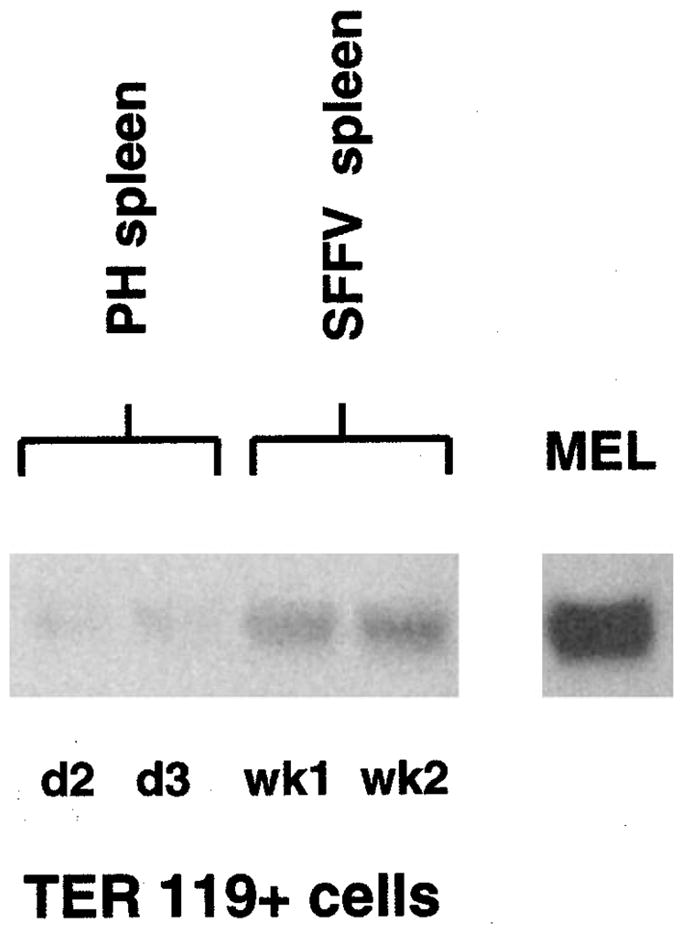
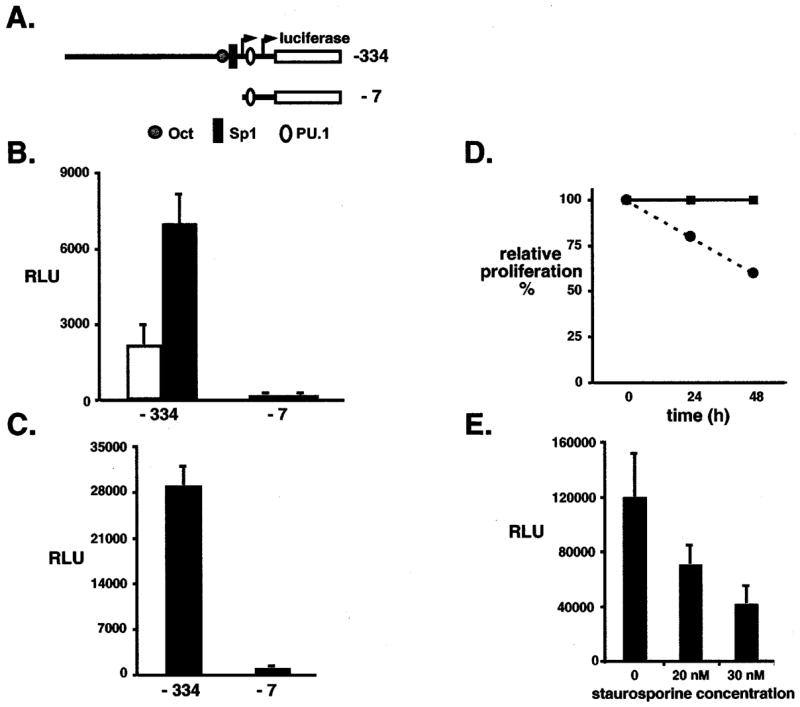
Cancer is a multi-step, multi-genetic event. Whether oncogenic mutations cooperate with one another to transform cells and how is not well understood. The Friend murine retroviral erythroleukemia model involves mitogenic activation of the erythropoietin receptor (EpoR) by the virus env gene (F-gp55), aberrant over-expression of the transcription factor PU.1, and inactivating mutations in p53. In this report we demonstrate that concurrent expression of F-gp55 and PU.1 in erythroid target cells, in vivo, cooperate to accelerate erythroleukemia induction. Early in the disease, prior to the detection of clonal leukemic cells, activation of the EpoR by F-gp55, but not erythropoietin, resulted in transcriptional upregulation of PU.1 through a trans regulatory mechanism. This could occur in the absence of an integrated provirus within the PU.1 gene locus. The regulation of PU.1 transcription in established erythroleukemia cell lines differed depending upon the level of PU.1 protein present. Our results suggest that the action of F-gp55 contributes to both early and late stages of Friend erythroleukemia and that persistence of F-gp55 expression may be required not only to initiate erythroleukemia but to also maintain erythroleukemia following Friend virus infection.


Figures

Figure 1
Figure 1
Co-expression of PU.1 and F-gp55 in murine erythroid progenitor cells accelerated both stages of Friend erythroleukemia, in vivo. (a) Schematic representation of retroviral constructs. A myc epitope tag (black box) was placed at the N-terminus of retroviral PU.1. (b) Weekly blood hematocrit levels of retrovirally-infected mice. SFF.F-gp55 virus, filled squares; SFF.F-gp55/PU.1 virus, open circles; SFF.PU.1 virus, open squares. For each virus five mice were infected. Results represent the mean and the standard deviation from the mean. (c) Tumorigenic assays. Mice were infected with SFF.F-gp55 virus (white columns), or SFF.F-gp55/PU.1 virus (black columns). Each week following infection splenic cells were isolated and 1000 cells plated in methylcellulose media without any added cytokines. Ten days following initiation of culture erythroid colonies were identified and scored. Three mice were analysed at each time point. Results represent the mean and the standard deviation from the mean. (d) Immunoblot analysis of splenic extracts from mice infected with viruses. Splenic extracts were prepared from mice 6 weeks following infection with virus: SFF.F-gp55, lane 1, SFF.F-gp55/PU.1, lane 2, and SFF.PU.1, lane 3. Anti-myc immunoblot, upper panel, and anti-F-gp55 immunoblot, lower panel
Figure 2
Figure 2
Activation of the EpoR by F-gp55, but not Epo, resulted in increased PU.1 transcription, independent of SFFV proviral integration. (a) F-gp55 immunoblot analysis for F-gp55 expression in 32D.EpoR cells (lane 1) and 32D.EpoR/F-gp55 cells (lane 2). Equal amounts of protein were loaded in each lane. The mobility of molecular size markers, in kDa, is on the left. (b) RNase protection assays for PU.1 mRNA expression in 32D.EpoR (32D.E) cells grown in IL-3 (5% WEHI culture supernatant) (lane 1) or 0.5 U/ml Epo (lane 2). 32D.EpoR/F-gp55 (32D.E/F) cells growing in IL-3-containing media (lane 3), or in the absence of any added growth factors (lane 4). (c) Nuclear run-on transcription assay for de novo transcription of GAPDH, PU.1 and CIS genes in 32D.EpoR (32D.E) cells (lane 1) and 32D.EpoR/F-gp55 (32D.E/F) cells (lane 2), as described in Materials and methods. (d) Southern blot analysis of the PU.1 gene organization in 32D.EpoR (32D.E) cells (lane 1), 32D.EpoR/F-gp55 (32D.E/F) cells (lane 2), and Friend erythroleukemia MEL cells (lane 3). Ten ug of genomic DNA was digested with EcoRV, and hybridized with probe A of the PU.1 gene (Moreau-Gachelin et al., 1989). The mobility of molecular size markers, in kilobases, is shown on the left
Figure 3
Figure 3
PU.1 transcription is increased in primary erythroblasts from mice infected with SFFV virus (PH). Total RNA was prepared from TER-119+primary erythroblasts isolated from the spleens of mice treated with phenylhydrazine (lane 1 – day 2 post treatment; lane 2 – day 3 post treatment) or infected with SFFV virus (lane 3 – 1 week post infection; lane 4 – 2 weeks post infection). Lane 5 is a sample from the established Friend erythroleukemia cell line MEL. 10 ug of total RNA was loaded in each lane
Figure 4
Figure 4
PU.1 promoter activity is increased following activation of the EpoR by F-gp55. (a) Schematic representation of the minimal murine PU.1 promoter luciferase plasmid (−334) and an inactive PU.1 promoter reporter plasmid (−7). Octamer (Oct), Sp1 and PU.1 binding sites within the promoter are highlighted. The horizontal arrows identify the location of the transcriptional start sites. The left arrow is the site utilized in 32D myeloid cells whereas the right arrow marks the site utilized in Friend erythroleukemia cells. (b) 32D.EpoR cells (white column) and 32D.EpoR/F-gp55 cells (black column) were transfected with PU.1 promoter reporter plasmid and CMV.beta-galactosidase plasmid in a 10:1 ratio. Results were normalized to beta-galactosidase activity and protein levels and reported as the relative luciferase units (RLU). Results represent the mean and the standard deviation from the mean for three to four independent experiments. (c) MEL cells were transfected with PU.1 promoter reporter plasmid and CMV.beta-galactosidase plasmid in a 10:1 ratio. Results were normalized to beta-galactosidase activity and protein levels and reported as the relative luciferase units (RLU). Results represent the mean and the standard deviation from the mean for three to four independent experiments. (d) MEL cell proliferation curve. MEL cells were grown in regular media (filled squares, solid line) or following the addition of 30 nM staurosporine (PKC inhibitor) (filled circles, dashed line). Results are presented as percent growth in regular media. (e) MEL cells were transfected with the minimal PU.1 promoter reporter plasmid (−334) and CMV.beta-galactosidase plasmid in a 10:1 ratio, then grown in the presence of increasing concentration of staurosporine for 26 h. Results were normalized to beta-galactosidase activity and protein levels and reported as the relative luciferase units (RLU). Results represent the mean and the standard deviation from the mean for three to four independent experiments
Figure 5
Figure 5
PU.1 promoter activity in Friend erythroleukemia cells. (a) Schematic representation of mouse minimal PU.1 promoter reporter plasmid (−334) and progressive deletions of the minimal promoter. (b) MEL cells were transfected with PU.1 promoter reporter plasmid and CMV.beta-galactosidase plasmid in a 10:1 ratio. Results were normalized to beta-galactosidase activity and protein levels and reported as the relative luciferase units (RLU). Results represent the mean and the standard deviation from the mean for three to four independent experiments. (c) Schematic representation of the minimal mouse PU.1 promoter reporter plasmid (−334) and promoter isoforms containing disabling point mutations (X) in the Oct (− Oct), Sp1 (− Sp1), and PU.1 (− PU.1) binding sites. (d) MEL cells were transfected as in (b). Results were normalized to beta-galactosidase activity and protein levels and reported as the relative luciferase units (RLU). Results represent the mean and the standard deviation from the mean for three to four independent experiments
Figure 6
Figure 6
PU.1 promoter regulation in Friend erythroleukemia cells differed depending upon the level of PU.1 protein present. (a) Schematic representation of minimal PU.1 promoter (−334) and a disabling point mutation (X) in the PU.1 binding site (− PU.1). (b) MEL cells were transfected with −334 or −PU.1 promoter reporter plasmid and CMV.beta-galactosidase plasmid in a 10:1 ratio, then treated with (+) 1.5% DMSO or without (−) for 17 h. Results were normalized to beta-galactosidase activity and protein levels and reported as the relative luciferase units (RLU). Results represent the mean and standard deviation from the mean for three to four independent experiments. White columns represent −DMSO treatment. Black columns represent+DMSO treatment. Panel on the right is an immunoblot analysis for PU.1 protein levels in cells following DMSO treatment (+) or without DMSO treatment (−). Equal amounts of total protein were loaded in each lane. (c) MEL-B8/3 cells were transfected as described in (b) and then treated with 100 uM ZnCl2(+) or not (−) for 17 h. Results were normalized to beta-galactosidase activity and protein levels and reported as the relative luciferase units (RLU). Results represent the mean and standard deviation from the mean for three to four independent experiments. White columns represent+Zn treatment. Black columns represent −Zn treatment. Panel on the right is an immunoblot analysis for PU.1 protein levels in cells following Zn treatment (+) or without Zn treatment (−). Equal amounts of total protein were loaded in each lane

Similar articles

Cited by

References

    1. Barnache S, Wendling F, Lacombe C, Denis N, Titeux M, Vainchecker W, Moreaeu-Gachelin F. Oncogene. 1998;16:2989–2995. - PubMed
    1. Beckman DL, Lin LL, Quinones ME, Longmore GD. Blood. 1999;94:2667–2675. - PubMed
    1. Ben-David Y, Bernstein A. Cell. 1991;66:831–834. - PubMed
    1. Bestwick RK, Kozak SL, Kabat D. Proc Natl Acad Sci (USA) 1988;85:5404–5408. - PMC - PubMed
    1. Chen H, Ray-Gallet D, Zhang P, Hetherington CJ, Gonzalez DA, Zhang D-E, Moreau-Gachelin F, Tenen DG. Oncogene. 1995;11:1549–1560. - PubMed

Publication types

MeSH terms