

Pulmonary inflammation induced by Pseudomonas aeruginosa lipopolysaccharide, phospholipase C, and exotoxin A: role of interferon regulatory factor 1
- PMID: 11854220
- PMCID: PMC127789
- DOI: 10.1128/IAI.70.3.1352-1358.2002
Pulmonary inflammation induced by Pseudomonas aeruginosa lipopolysaccharide, phospholipase C, and exotoxin A: role of interferon regulatory factor 1
Abstract
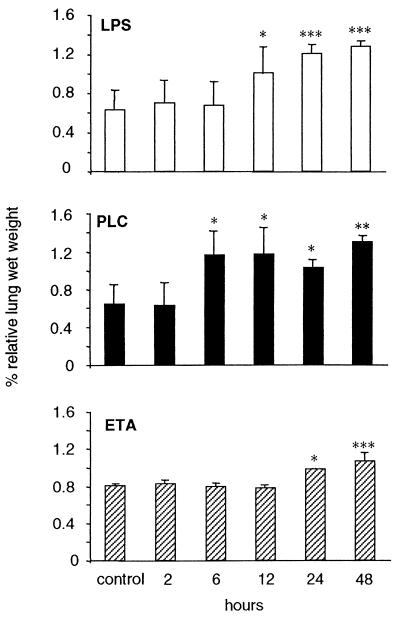
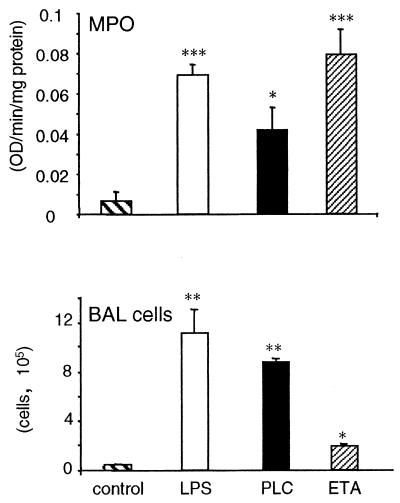
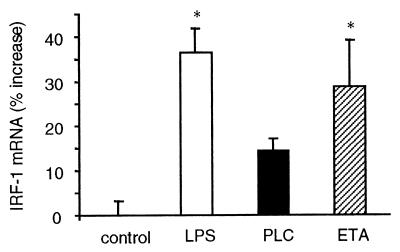
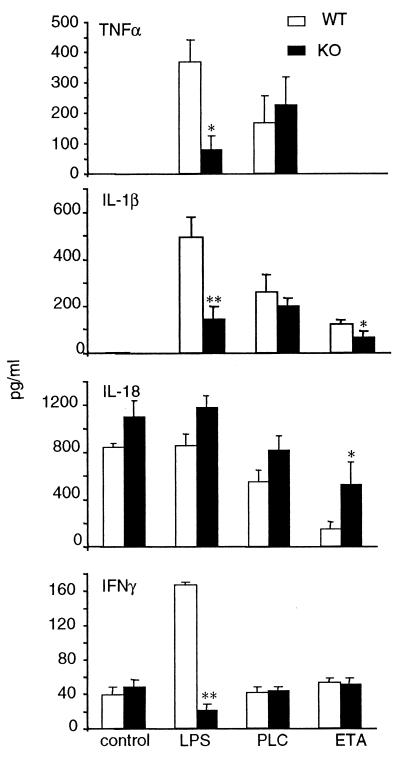
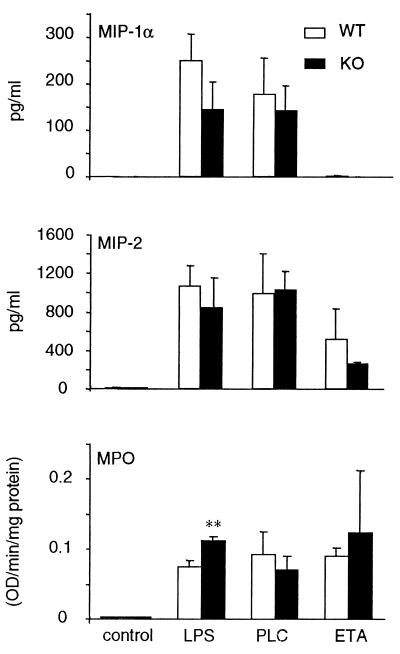
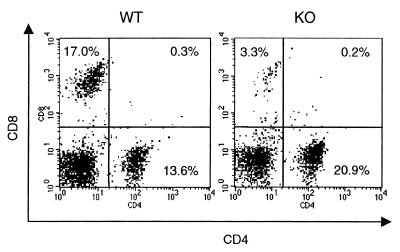
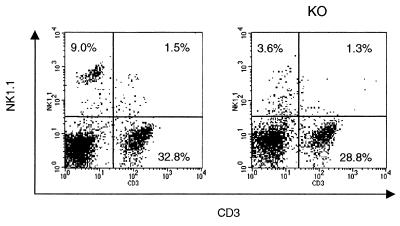
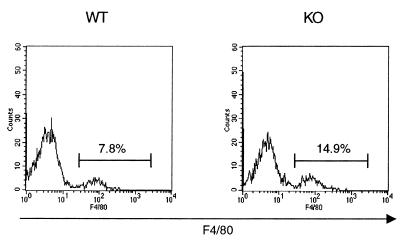
Chronic pulmonary infection with Pseudomonas aeruginosa is common in cystic fibrosis (CF) patients. P. aeruginosa lipopolysaccharide (LPS), phosholipase C (PLC), and exotoxin A (ETA) were evaluated for their ability to induce pulmonary inflammation in mice following intranasal inoculation. Both LPS and PLC induced high levels of tumor necrosis factor alpha (TNF-alpha), interleukin 1 beta (IL-1 beta-6, gamma interferon (IFN-gamma), MIP-1 alpha MIP-2 in the lungs but did not affect IL-18 levels. ETA did not induce TNF-alpha and was a weak inducer of IL-1 beta, IL-6, macrophage inflammatory protein 1 alpha (MIP-1 alpha), and MIP-2. Remarkably, ETA reduced constitutive lung IL-18 levels. LPS was the only factor inducing IFN-gamma. LPS, PLC, and ETA all induced cell infiltration in the lungs. The role of interferon regulatory factor-1 (IRF-1) in pulmonary inflammation induced by LPS, PLC, and ETA was evaluated. When inoculated with LPS, IRF-1 gene knockout (IRF-1 KO) mice produced lower levels of TNF-alpha, IL-1 beta, and IFN-gamma than did wild-type (WT) mice. Similarly, a milder effect of ETA on IL-1 beta and IL-18 was observed for IRF-1 KO than for WT mice. In contrast, the cytokine response to PLC did not differ between WT and IRF-1 KO mice. Accordingly, LPS and ETA, but not PLC, induced expression of IRF-1 mRNA. IRF-1 deficiency had no effect on MIP-1 alpha and MIP-2 levels and on cell infiltration induced by LPS, PLC, or ETA. Flow cytometric evaluation of lung mononuclear cells revealed strongly reduced percentages of CD8(+) and NK cells in IRF-1 KO mice compared to percentages observed for WT mice. These data indicate that different virulence factors from P. aeruginosa induce pulmonary inflammation in vivo and that IRF-1 is involved in some of the cytokine responses to LPS and ETA.
Figures
Similar articles
-
Induction of tumor necrosis factor (TNF) and interleukin-1 (IL-1) by Pseudomonas aeruginosa and exotoxin A-induced suppression of lymphoproliferation and TNF, lymphotoxin, gamma interferon, and IL-1 production in human leukocytes.Infect Immun. 1992 Aug;60(8):3162-8. doi: 10.1128/iai.60.8.3162-3168.1992. Infect Immun. 1992. PMID: 1639487 Free PMC article.
-
Effect of Pseudomonas aeruginosa exotoxin A on endotoxin-induced tumour necrosis factor production in murine lung.J Med Microbiol. 1999 May;48(5):471-477. doi: 10.1099/00222615-48-5-471. J Med Microbiol. 1999. PMID: 10229544
-
Regulation of lipopolysaccharide sensitivity by IFN regulatory factor-2.J Immunol. 2003 Jun 1;170(11):5739-47. doi: 10.4049/jimmunol.170.11.5739. J Immunol. 2003. PMID: 12759457
-
The role of the interferon regulatory factors, IRF-1 and IRF-2, in LPS-induced cyclooxygenase-2 (COX-2) expression in vivo and in vitro.J Endotoxin Res. 2002;8(5):379-88. doi: 10.1179/096805102125000713. J Endotoxin Res. 2002. PMID: 12537697
-
The role of interferon regulatory factor-1 in cytokine-induced mRNA expression and cell death in murine pancreatic beta-cells.Eur Cytokine Netw. 1999 Sep;10(3):403-12. Eur Cytokine Netw. 1999. PMID: 10477397
Cited by
-
Homeostasis and catabolism of choline and glycine betaine: lessons from Pseudomonas aeruginosa.Appl Environ Microbiol. 2013 Apr;79(7):2112-20. doi: 10.1128/AEM.03565-12. Epub 2013 Jan 25. Appl Environ Microbiol. 2013. PMID: 23354714 Free PMC article. Review.
-
Impact of Bacterial Toxins in the Lungs.Toxins (Basel). 2020 Apr 2;12(4):223. doi: 10.3390/toxins12040223. Toxins (Basel). 2020. PMID: 32252376 Free PMC article. Review.
-
The In Vivo and In Vitro Assessment of Pyocins in Treating Pseudomonas aeruginosa Infections.Antibiotics (Basel). 2022 Oct 7;11(10):1366. doi: 10.3390/antibiotics11101366. Antibiotics (Basel). 2022. PMID: 36290026 Free PMC article. Review.
-
Choline catabolism to glycine betaine contributes to Pseudomonas aeruginosa survival during murine lung infection.PLoS One. 2013;8(2):e56850. doi: 10.1371/journal.pone.0056850. Epub 2013 Feb 14. PLoS One. 2013. PMID: 23457628 Free PMC article.
-
Hemolytic phospholipase C inhibition protects lung function during Pseudomonas aeruginosa infection.Am J Respir Crit Care Med. 2011 Aug 1;184(3):345-54. doi: 10.1164/rccm.201103-0374OC. Epub 2011 May 11. Am J Respir Crit Care Med. 2011. PMID: 21562128 Free PMC article.
References
-
- Balough, K., M. McCubbin, M. Weinberger, W. Smits, R. Ahrens, and R. Fick. 1995. The relationship between infection and inflammation in the early lung disease from cystic fibrosis. Ped. Pulmonol. 20:63-70. - PubMed
-
- Cheng, G., A. S. Nazar, H. S. Shin, P. Vanguri, and M. L. Shin. 1998. IP-10 gene transcription by virus in astrocytes requires cooperation of ISRE with adjacent kappaB site but not IRF-1 or viral transcription. J. Interferon Cytokine Res. 18:987-997. - PubMed
-
- Dinarello, C. A. 1999. Interleukin-18. Methods 19:121-132. - PubMed
Publication types
MeSH terms
Substances
Grants and funding
LinkOut - more resources
Full Text Sources
Other Literature Sources
Medical
Research Materials
Miscellaneous
