. 2002 Feb;109(4):525-32.
doi: 10.1172/JCI14550.

Targeted disruption of the Chop gene delays endoplasmic reticulum stress-mediated diabetes

Affiliations

Targeted disruption of the Chop gene delays endoplasmic reticulum stress-mediated diabetes

Seiichi Oyadomari et al. J Clin Invest. 2002 Feb.

Abstract

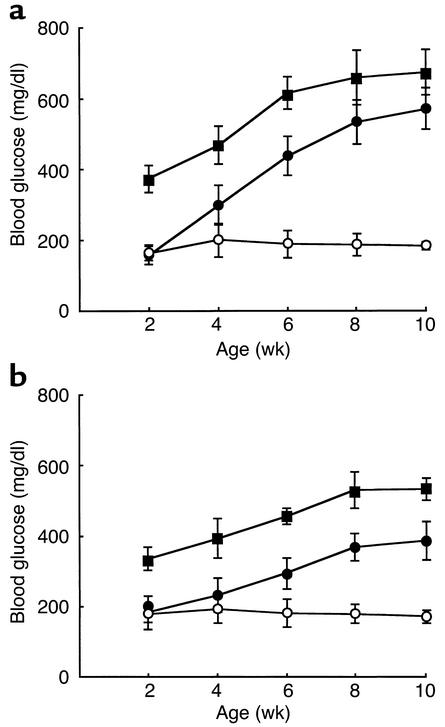
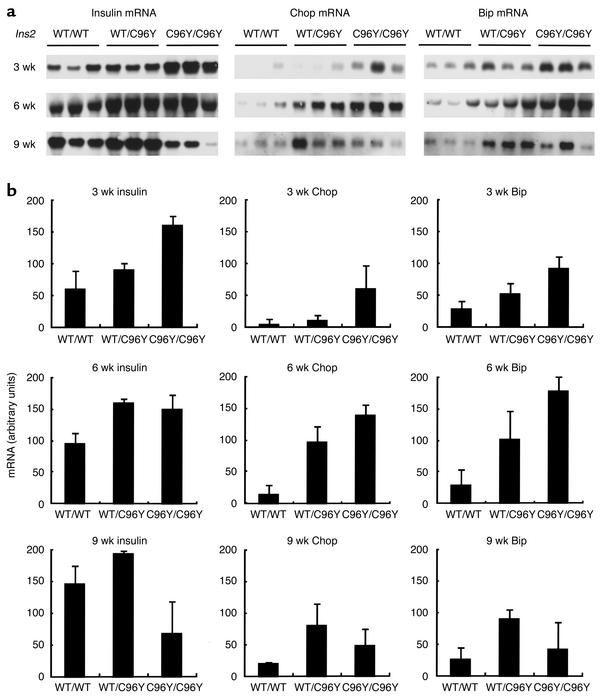
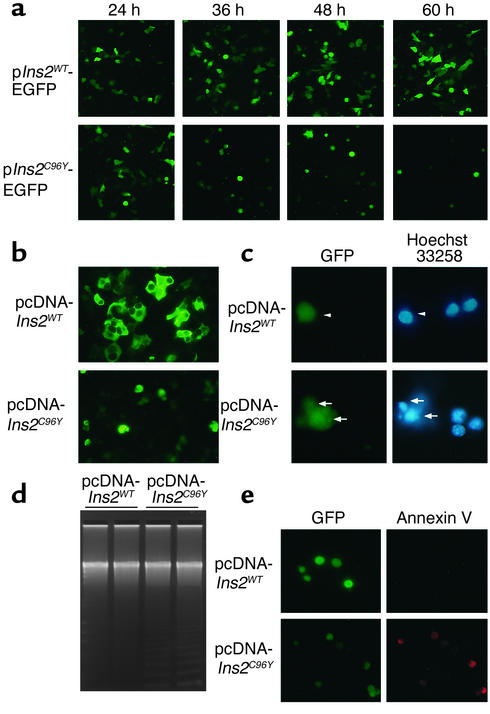
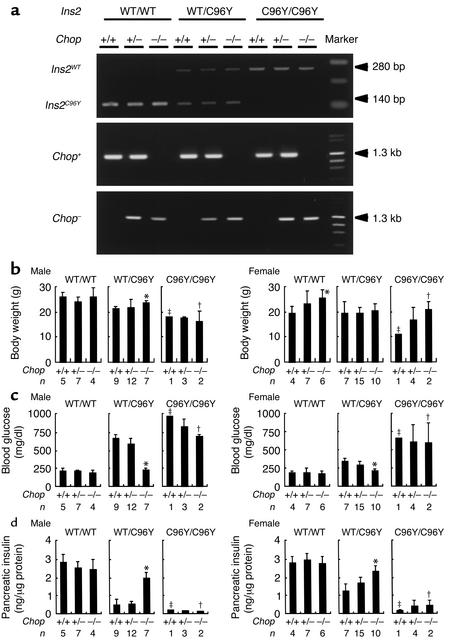
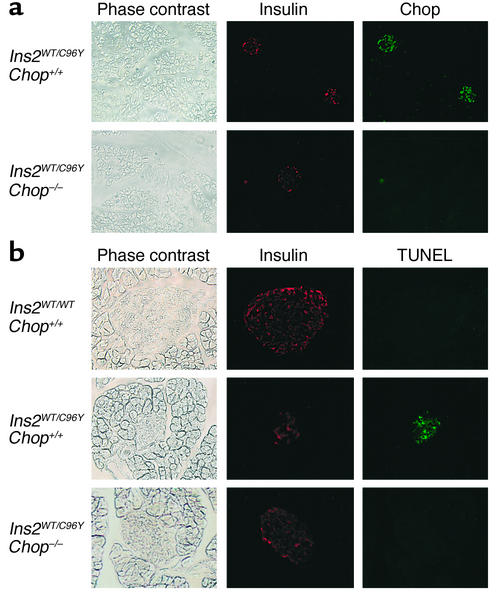
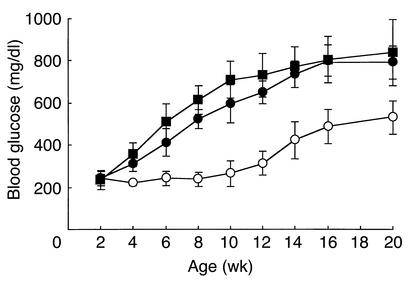
Overload of pancreatic beta cells in conditions such as hyperglycemia, obesity, and long-term treatment with sulfonylureas leads to beta cell exhaustion and type 2 diabetes. Because beta cell mass declines under these conditions, apparently as a result of apoptosis, we speculated that overload kills beta cells as a result of endoplasmic reticulum (ER) stress. The Akita mouse, which carries a conformation-altering missense mutation (Cys96Tyr) in Insulin 2, likewise exhibits hyperglycemia and a reduced beta cell mass. In the development of diabetes in Akita mice, mRNAs for the ER chaperone Bip and the ER stress-associated apoptosis factor Chop were induced in the pancreas. Overexpression of the mutant insulin in mouse MIN6 beta cells induced Chop expression and led to apoptosis. Targeted disruption of the Chop gene delayed the onset of diabetes in heterozygous Akita mice by 8-10 weeks. We conclude that ER overload in beta cells causes ER stress and leads to apoptosis via Chop induction. Our findings suggest a new therapeutic approach for preventing the onset of diabetes by inhibiting Chop induction or by increasing chaperone capacity in the ER.


Figures

Figure 1
Figure 1
Development of diabetes in Akita mice. Mice were provided food ad libitum, and blood glucose was measured between 9:00 a.m. and 10:00 a.m. at indicated age. (a) Male. (b) Female. Wild-type Ins2WT/WT mice (open circles), heterozygous Ins2WT/C96Y mice (filled circles), and homozygous Ins2C96Y/C96Y mice (filled squares) are represented. Data are shown as mean ± SD (n = 10).
Figure 2
Figure 2
Northern blot analysis for insulin, Chop, and Bip mRNAs in the pancreas of male Akita mice. (a) Chemiluminescent images for insulin, Chop, and Bip mRNAs at the indicated ages are shown. Total RNAs (2.0 mg) from the pancreas of each genotype were subjected to Northern blot analysis. The results at 3, 6, and 9 weeks of age were obtained under essentially identical conditions. (b) Quantification of the results obtained in a, shown as mean ± SD (n = 3).
Figure 3
Figure 3
Apoptosis in MIN6 cells overexpressing Ins2C96Y–EGFP and Ins2C96Y. (a) Cells were transfected with pIns2WT-EGFP or pIns2C96Y-EGFP. At the indicated times after transfection, cells were observed under a fluorescence microscope. Original magnification: ×100. (b) Cells were cotransfected with pEYFP-ER and either pcDNA-Ins2WT or pcDNA-Ins2C96Y. Forty-eight hours after transfection, cells were observed under a fluorescence microscope. Original magnification: ×200. (c) Cells were cotransfected with pEGFP and either pcDNA-Ins2WT or pcDNA-Ins2C96Y. The transfected cells and apoptotic cells were visualized by GFP fluorescence and Hoechst 33258 staining, respectively. pcDNA-Ins2WT–transfected cells were not apoptotic (arrowheads), whereas pcDNA-Ins2C96Y–transfected cells were apoptotic (arrows). Original magnification: ×400. (d) Cells were transfected with pcDNA-Ins2WT or pcDNA-Ins2C96Y. DNA was extracted, electrophoresed in 2% agarose gel, stained with SYBR Green I, and visualized by UV transillumination. (e) Cells were cotransfected with pEGFP and either pcDNA-Ins2WT or pcDNA-Ins2C96Y. The transfected cells and apoptotic cells were visualized by GFP fluorescence and annexin V staining, respectively. Original magnification: ×200.
Figure 4
Figure 4
Characteristics of the double-mutant mice with Ins2 mutation and Chop disruption. (a) Genotyping of double-mutant mice. Representative genotyping of the Ins2 gene by RFLP; the Chop gene from nine mutant lines is shown by PCR. Ins2 exon 3 was amplified by PCR using genomic DNA. The Ins2C96Y mutation in Akita mice disrupts an Fnu4HI site in exon 3 of Ins2. Digestion with Fnu4HI did not change the size of the PCR product from the mutated allele (280 bp), but it decreased that of the wild-type allele to 140 bp. Primers for wild-type and mutated Chop mice are described in Methods. The left lane shows 100-bp DNA ladder markers (top panel) and λDNA/Hind III + φ×174DNA/Hae III fragment markers (middle and bottom panels). (bd) Phenotypic characterization of double-mutant mice at 8 weeks of age. (b) Body weight. (c) Morning blood glucose. (d) Pancreatic insulin content. Data are shown as mean ± SD. Significant differences among the genotype of the CHOP gene were evaluated by the Student t test: *P < 0.001 versus Chop+/+. Ins2C96Y/C96YChop+/+ mice died within days of birth. Therefore, data are shown as only one mouse and data are shown as means ± ranges (n = 2).
Figure 5
Figure 5
Immunohistochemical detection of Chop and apoptosis in islets of male Ins2WT/WTChop+/+, Ins2WT/C96YChop+/+, and Ins2WT/C96YChop–/– mice. (a) Immunostaining of insulin and Chop. The pancreata from Ins2WT/C96YChop+/+ and Ins2WT/C96YChop–/– male mice at 4 weeks of age were fixed and then costained for insulin (red) and Chop (green). Phase-contrast images and fluorescence images of the same fields are shown. Original magnification: ×100. (b) Apoptosis detection by the TUNEL method. The pancreata from Ins2WT/WTChop+/+, Ins2WT/C96YChop+/+, and Ins2WT/C96YChop–/– male mice were obtained and costained for insulin (red) and TUNEL-positive cells (green). Phase-contrast images and fluorescence images of the same fields are shown. Original magnification: ×200.
Figure 6
Figure 6
Development of diabetes in male Ins2WT/C96YChop+/+, Ins2WT/C96YChop+/–, and Ins2WT/C96YChop–/– mice. Mice were provided food ad libitum, and blood glucose was measured between 9:00 a.m. and 10:00 a.m. Ins2WT/C96YChop+/+ mice (filled squares), Ins2WT/C96YChop+/– mice (filled circles), and Ins2WT/C96YChop–/– mice (open circles) are represented. Data are shown as mean ± SD (n = 7).

Comment in

References

    1. Stefan Y, et al. Quantitation of endocrine cell content in the pancreas of nondiabetic and diabetic humans. Diabetes. 1982;31:694–700. - PubMed
    1. Rahier J, Goebbels RM, Henquin JC. Cellular composition of the human diabetic pancreas. Diabetologia. 1983;24:366–371. - PubMed
    1. Kaufman RJ. Stress signaling from the lumen of the endoplasmic reticulum: coordination of gene transcriptional and translational controls. Genes Dev. 1999;13:1211–1233. - PubMed
    1. Mori K. Tripartite management of unfolded proteins in the endoplasmic reticulum. Cell. 2000;101:451–454. - PubMed
    1. Travers KJ, et al. Functional and genomic analyses reveal an essential coordination between the unfolded protein response and ER-associated degradation. Cell. 2000;101:249–258. - PubMed

Publication types

MeSH terms