An NMR approach to structural proteomics
- PMID: 11854485
- PMCID: PMC122278
- DOI: 10.1073/pnas.042684599
An NMR approach to structural proteomics
Abstract
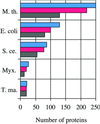
The influx of genomic sequence information has led to the concept of structural proteomics, the determination of protein structures on a genome-wide scale. Here we describe an approach to structural proteomics of small proteins using NMR spectroscopy. Over 500 small proteins from several organisms were cloned, expressed, purified, and evaluated by NMR. Although there was variability among proteomes, overall 20% of these proteins were found to be readily amenable to NMR structure determination. NMR sample preparation was centralized in one facility, and a distributive approach was used for NMR data collection and analysis. Twelve structures are reported here as part of this approach, which allowed us to infer putative functions for several conserved hypothetical proteins.
Figures


References
-
- Smith T. Nat Struct Biol Suppl. 2000;7:927.
-
- Christendat D, Yee A, Dharamsi A, Kluger Y, Savchenko A, Cort J R, Booth V, Mackereth C D, Saridakis V, Ekiel I, et al. Nat Struct Biol. 2000;7:903–909. - PubMed
-
- Delaglio F, Grzesiek S, Vuister G W, Zhu G, Pfeifer J, Bax A. J Biomol NMR. 1995;6:277–293. - PubMed
-
- Serber Z, Keatinge-Clay A T, Ledwidge R, Kelly A E, Miller S M, Dotsch V. J Am Chem Soc. 2001;123:2446–2447. - PubMed
Publication types
MeSH terms
Substances
Associated data
- Actions
- Actions
- Actions
- Actions
- Actions
- Actions
- Actions
- Actions
- Actions
- Actions
- Actions
Grants and funding
LinkOut - more resources
Full Text Sources
Other Literature Sources
Molecular Biology Databases

