. 2002 Feb 19;99(4):1921-5.
doi: 10.1073/pnas.042683699.

Differential effects of a centrally acting fatty acid synthase inhibitor in lean and obese mice

Affiliations

Differential effects of a centrally acting fatty acid synthase inhibitor in lean and obese mice

Monica V Kumar et al. Proc Natl Acad Sci U S A. .

Erratum in

  • Proc Natl Acad Sci U S A 2002 May 28;99(11):7809

Abstract

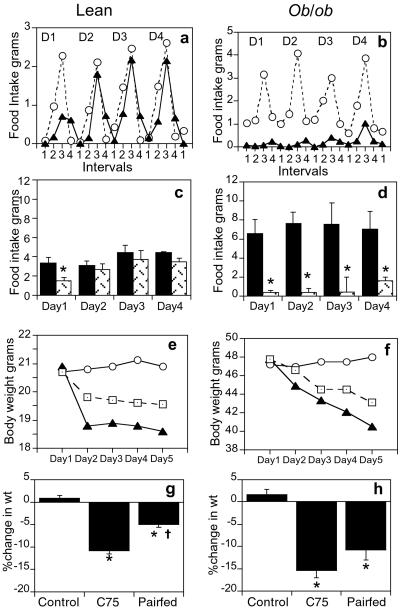
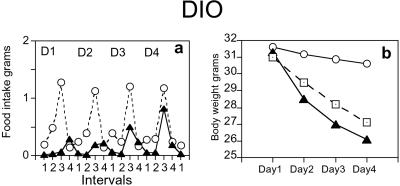
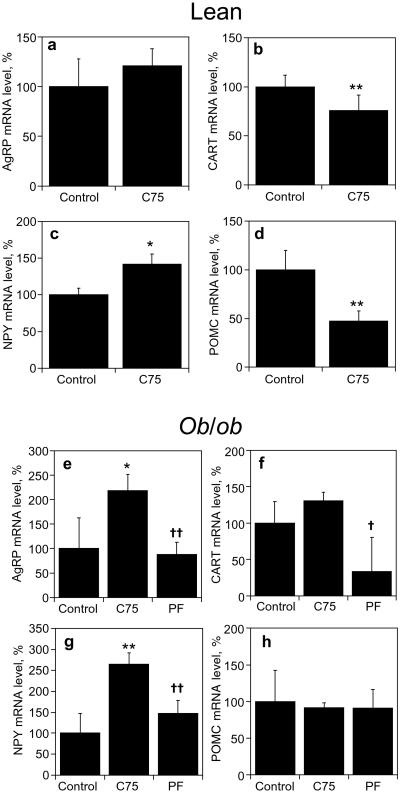
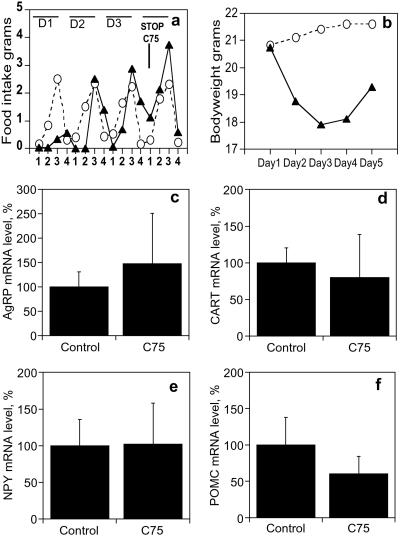
C75 is a potent inhibitor of fatty acid synthase that acts centrally to reduce food intake and body weight in mice; a single dose causes a rapid (>90%) decrease of food intake. These effects are associated with inhibition of fasting-induced up-regulation and down-regulation, respectively, of the expression of orexigenic (NPY and AgRP) and anorexigenic (POMC and CART) neuropeptide messages in the hypothalamus. Repeated administration of C75 at a submaximal level, however, differentially affected food intake of lean and obese mice. With lean mice, C75 suppressed food intake by approximately 50% and, with obese mice (ob/ob and dietary-induced obesity), by 85-95% during the first day of treatment. Lean mice, however, became tolerant/resistant to C75 over the next 2-5 days of treatment, with food intake returning to near normal and rebound hyperphagia occurring on cessation of treatment. In contrast, ob/ob obese mice responded to C75 with a >90% suppression of food intake throughout the same period with incipient tolerance becoming evident only after substantial weight loss had occurred. Dietary-induced obese mice exhibited intermediate behavior. In all cases, a substantial loss of body weight resulted. Pair-fed controls lost 24-50% less body weight than C75-treated mice, indicating that, in addition to suppressing food intake, C75 may increase energy expenditure. The decrease in body weight by ob/ob mice was due primarily to loss of body fat. In contrast to the short-term effects of C75 on "fasting-induced" changes of hypothalamic orexigenic and anorexigenic neuropeptide mRNAs, repeated administration of C75 either had the inverse or no effect as tolerance developed.


Figures

Figure 1
Figure 1
Effect of C75 on food intake and body weight in lean (C57BL/6J) and ob/ob mice. Mice were acclimated to 12-h dark (1800–0600 h)/12-h light (0600–1800 h) cycle. Groups of lean mice (n = 4) or ob/ob mice (n = 3) received a daily i.p. injection of vehicle (control) or C75 3 h before lights off (1500). (a and b) Food consumption was measured in lean and ob/ob mice treated with vehicle (○) or C75 (▴) during various intervals after injection (interval 1, 1500–1800 h; interval 2, 1800–2100 h; interval 3, 2100–0900 h; interval 4, 0900–1500 h) over 4 days (D1, D2, D3, and D4. (c and d) Twenty four-hour cumulative food intake in vehicle (black bars) and C75-treated (hatched bars) lean and ob/ob mice. (e and f) Body weight was measured daily in lean and ob/ob mice treated with vehicle (○), C75 (▴), or mice pair-fed (□) the same quantity of food consumed by C75-treated mice. (g and h) Percent change from initial body weight in vehicle-treated, C75-treated, and pair-fed lean and ob/ob mice. All data are mean ± SEM. *P < 0.05 versus corresponding vehicle control; 61 P < 0.05 vs. corresponding pair-fed controls.
Figure 2
Figure 2
Effect of C75 on food intake and body weight in DIO mice. Mice were acclimated to a 12-h dark (1800–0600 h)/12-h light (0600–1800 h) cycle. Groups of DIO mice (n = 4) received a daily i.p. injection of vehicle (control) or C75 3 h before lights off (1500 h). (a) Food consumption was measured in DIO mice during various intervals after injection (interval 1, 1500–1800 h; interval 2, 1800–2100 h; interval 3, 2100–0900 h; interval 4, 0900–1500 h). (b) Body weight was measured daily in DIO mice treated with vehicle (control), C75, or mice pair-fed the same quantity of food consumed by C75-treated mice. Other labels are the same as in Fig. 1 a and e.
Figure 3
Figure 3
Effect of C75 on hypothalamic neuropeptide mRNA levels in lean and ob/ob mice. Groups of mice (n = 4 for lean and n = 3 for ob/ob) received a daily injection of vehicle (control) or C75 (10 mg/kg bw) 3 h before lights off (at 1500) for 5 days. Mice were killed 3 h after the last injection (at 1800 on day 5) and hypothalami were harvested. Total RNA (5 μg) was probed with a probe mixture containing [32P]UTP-labeled cRNAs for a and e (AgRP), b and f (CART), c and g (NPY), and d and h (POMC) and subjected to RNase protection protocol as described in Experimental Procedures. mRNA levels are expressed as % relative to mRNA level in corresponding control mice. All data are means ± SE. *, P < 0.05; **, P < 0.01 vs. control group; †, P < 0.01 vs. C75-treated group.
Figure 4
Figure 4
Rebound hyperphagia and hypothalamic neuropeptide levels in lean mice after cessation of C75. Groups of lean mice (n = 4) received daily i.p. injections of vehicle (control) or C75 3 h before lights off (1500 h) for 3 days, after which all treatment was stopped. (a) Food consumption was measured in lean mice treated with vehicle (○) or C75 (▴) during various intervals after injection (interval 1, 1500–1800 h; interval 2, 1800–2100 h; interval 3, 2100–0900 h; interval 4, 0900–1500 h) over 4 days (D1, D2, D3, D4). (b) Body weight was measured daily in lean mice treated with vehicle (○) or C75 (▴). Mice were killed 26 h after cessation of C75 (at 1800 on day 5), and hypothalami were harvested. Total RNA (5 μg) was probed with a probe mixture containing [32P]UTP-labeled cRNAs for c (AgRP), d (CART), e (NPY), and f (POMC) and subjected to RNase protection protocol as described in Experimental Procedures. mRNA levels are expressed as % relative to mRNA level in control mice. All data are means ± SE.

References

    1. Schwartz M W, Woods S C, Porte D, Jr, Seeley R J, Baskin D G. Nature (London) 2000;404:661–671. - PubMed
    1. Beck B. Nutrition. 2000;16:916–923. - PubMed
    1. Loftus T M, Jaworsky D E, Frehywot G L, Townsend C A, Ronnett G V, Lane M D, Kuhajda F P. Science. 2000;288:2379–2381. - PubMed
    1. Wakil S. Biochemistry. 1989;28:4523–4530. - PubMed
    1. Bouchard C. N Engl J Med. 2000;343:1888–1889. - PubMed

Publication types

LinkOut - more resources