. 2002 Feb 19;99(4):2216-21.
doi: 10.1073/pnas.042671399.

Overhauser enhanced magnetic resonance imaging for tumor oximetry: coregistration of tumor anatomy and tissue oxygen concentration

Affiliations

Overhauser enhanced magnetic resonance imaging for tumor oximetry: coregistration of tumor anatomy and tissue oxygen concentration

Murali C Krishna et al. Proc Natl Acad Sci U S A. .

Abstract

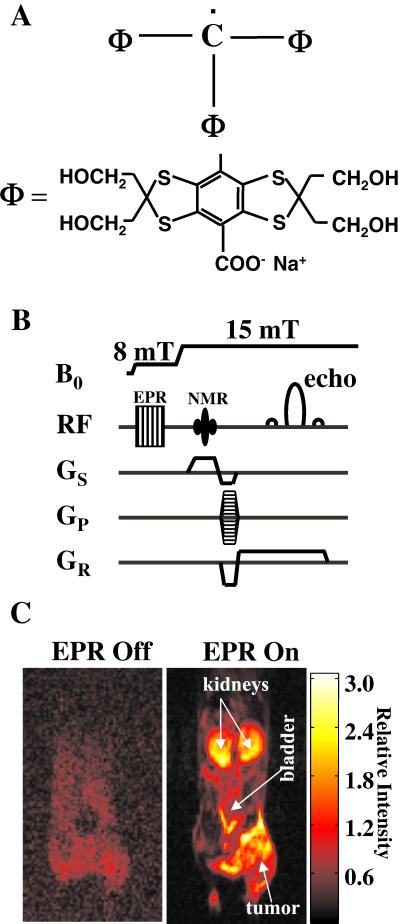
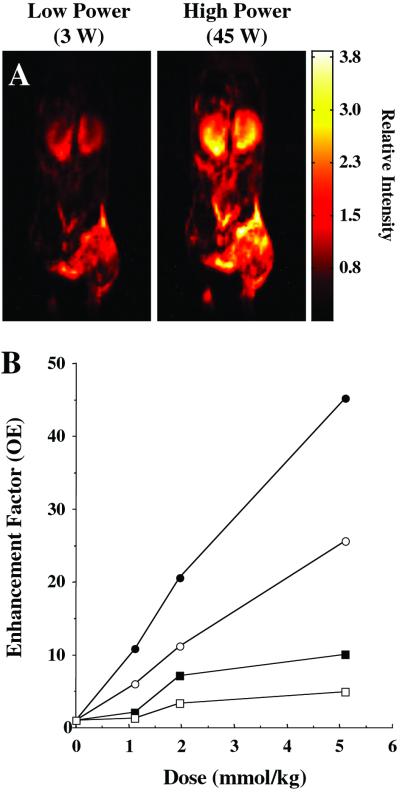
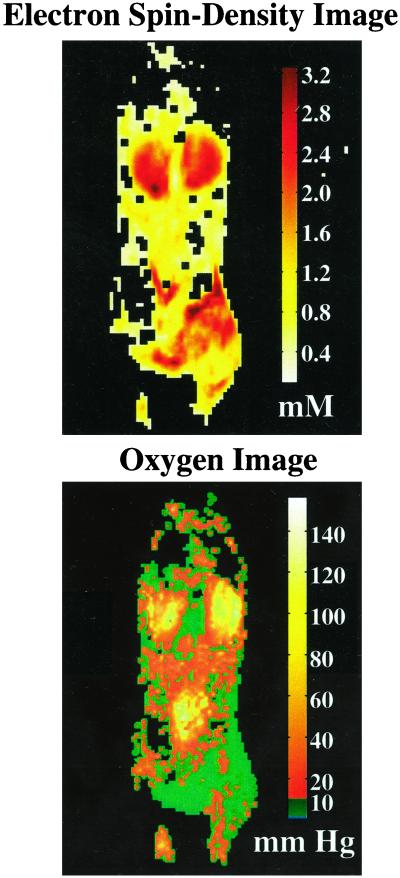
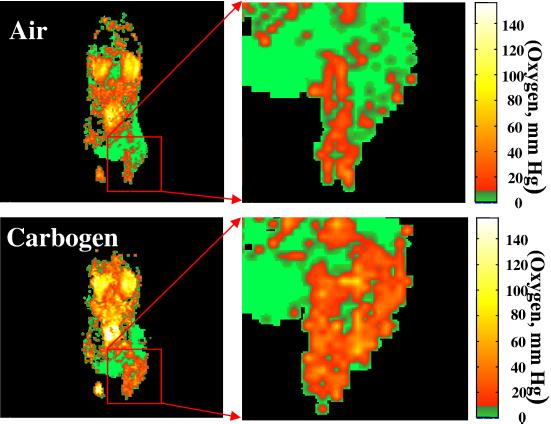
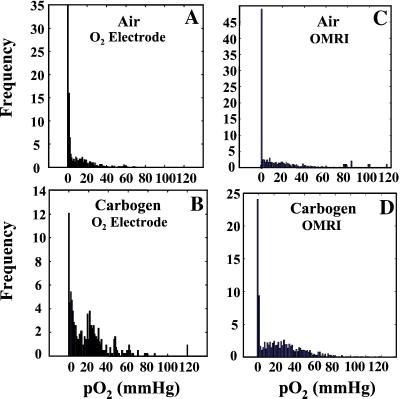
An efficient noninvasive method for in vivo imaging of tumor oxygenation by using a low-field magnetic resonance scanner and a paramagnetic contrast agent is described. The methodology is based on Overhauser enhanced magnetic resonance imaging (OMRI), a functional imaging technique. OMRI experiments were performed on tumor-bearing mice (squamous cell carcinoma) by i.v. administration of the contrast agent Oxo63 (a highly derivatized triarylmethyl radical) at nontoxic doses in the range of 2-7 mmol/kg either as a bolus or as a continuous infusion. Spatially resolved pO(2) (oxygen concentration) images from OMRI experiments of tumor-bearing mice exhibited heterogeneous oxygenation profiles and revealed regions of hypoxia in tumors (<10 mmHg; 1 mmHg = 133 Pa). Oxygenation of tumors was enhanced on carbogen (95% O(2)/5% CO(2)) inhalation. The pO(2) measurements from OMRI were found to be in agreement with those obtained by independent polarographic measurements using a pO(2) Eppendorf electrode. This work illustrates that anatomically coregistered pO(2) maps of tumors can be readily obtained by combining the good anatomical resolution of water proton-based MRI, and the superior pO(2) sensitivity of EPR. OMRI affords the opportunity to perform noninvasive and repeated pO(2) measurements of the same animal with useful spatial (approximately 1 mm) and temporal (2 min) resolution, making this method a powerful imaging modality for small animal research to understand tumor physiology and potentially for human applications.


Figures

Figure 1
Figure 1
(A) Structural formula of the contrast agent Oxo63, tris[8-carboxy-2,2,6,6-tetrakis(2-hydroxymethyl)benzo[1,2-d:4,5-d′]bis(1,3)dithio-4-yl]methyl radical, trisodium salt. (B) OMRI pulse-sequence diagram showing B0 field cycling and radiofrequency (RF) and field-gradient waveforms. (C) Interleaved (“EPR off” and “EPR on”) OMRI images (coronal) of a female C3H mouse, bearing SCC tumor on the right hind leg, demonstrating the Overhauser enhancement (OE) and the diagnostic quality achievable at this low magnetic field of 15 mT. The mouse was administered 3.8 mmol/kg Oxo63 by tail vein cannulation. Both images were acquired in the presence of the contrast agent. The image acquisition parameters are given in Materials and Methods.
Figure 2
Figure 2
(A) OMRI images taken at two different saturating EPR power levels. Image acquisition parameters are the same as given for Fig. 1. The SNR difference between these two images is 11, which enables reliable estimate of pO2 maps (Fig. 3) by using the algorithm described in the experimental section. (B) The enhancement factors as a function of Oxo63 dose, calculated for kidney (●, high power; ■, low power) and tumor (○, high power; □, low power). The enhancement factors were calculated as the ratio of mean pixel value of a region of interest in the Overhauser image to the mean of the same region of interest for the conventional MR image (EPR off).
Figure 3
Figure 3
Contrast agent and oxygen distribution maps of tumor-bearing female C3H mouse computed from OMRI images taken at two different power levels. The contrast in the spin-density image shows the differential accumulation of the spin probe, Oxo63. Nevertheless, the distribution is sufficient in many regions of interest to give an SNR above 10. The oxygen map indicates a relatively homogeneous pO2 in kidney in contrast to significant heterogeneity in tumor. (1 mmHg = 133 Pa.)
Figure 4
Figure 4
pO2 images a C3H mouse with a 1-cm diameter SCC tumor during air breathing (Upper) and carbogen breathing (Lower). The expanded tumor region, given at Right, clearly shows heterogeneity in pO2 distribution.
Figure 5
Figure 5
Comparison of pO2 histograms of tumor oxygen distribution computed from OMRI images, and independently obtained from oxygen electrode measurements for air and carbogen breathing.

References

    1. Horsman M R, Nordsmark M, Overgaard J. Strahlenther Onkol. 1998;174:2–5. - PubMed
    1. Stratford I J, Adams G E, Bremner J C, Cole S, Edwards H S, Robertson N, Wood P J. Int J Radiat Biol. 1994;65:85–94. - PubMed
    1. Maxwell P H, Dachs G U, Gleadle J M, Nicholls L G, Harris A L, Stratford I J, Hankinson O, Pugh C W, Ratcliffe P J. Proc Natl Acad Sci USA. 1997;94:8104–8109. - PMC - PubMed
    1. Hockel M, Schlenger K, Aral B, Mitze M, Schaffer U, Vaupel P. Cancer Res. 1996;56:4509–4515. - PubMed
    1. Giaccia A J. Semin Radiat Oncol. 1996;6:46–58. - PubMed