

Iron deficiency and iron excess damage mitochondria and mitochondrial DNA in rats
- PMID: 11854522
- PMCID: PMC122353
- DOI: 10.1073/pnas.261708798
Iron deficiency and iron excess damage mitochondria and mitochondrial DNA in rats
Abstract
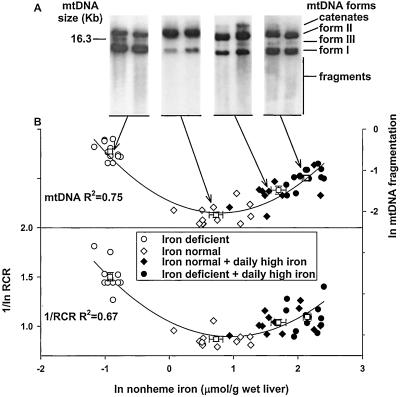
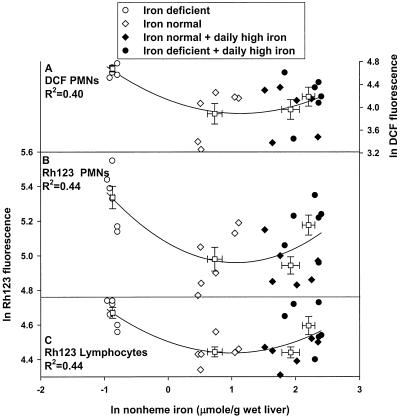
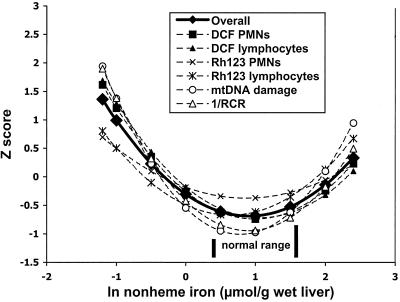
Approximately two billion people, mainly women and children, are iron deficient. Two studies examined the effects of iron deficiency and supplementation on rats. In study 1, mitochondrial functional parameters and mitochondrial DNA (mtDNA) damage were assayed in iron-deficient (< or =5 microg/day) and iron-normal (800 microg/day) rats and in both groups after daily high-iron supplementation (8,000 microg/day) for 34 days. This dose is equivalent to the daily dose commonly given to iron-deficient humans. Iron-deficient rats had lower liver mitochondrial respiratory control ratios and increased levels of oxidants in polymorphonuclear-leukocytes, as assayed by dichlorofluorescein (P < 0.05). Rhodamine 123 fluorescence of polymorphonuclear-leukocytes also increased (P < 0.05). Lowered respiratory control ratios were found in daily high-iron-supplemented rats regardless of the previous iron status (P < 0.05). mtDNA damage was observed in both iron-deficient rats and rats receiving daily high-iron supplementation, compared with iron-normal rats (P < 0.05). Study 2 compared iron-deficient rats given high doses of iron (8,000 microg) either daily or every third day and found that rats given iron supplements every third day had less mtDNA damage on the second and third day after the last dose compared to daily high iron doses. Both inadequate and excessive iron (10 x nutritional need) cause significant mitochondrial malfunction. Although excess iron has been known to cause oxidative damage, the observation of oxidant-induced damage to mitochondria from iron deficiency has been unrecognized previously. Untreated iron deficiency, as well as excessive-iron supplementation, are deleterious and emphasize the importance of maintaining optimal iron intake.
Figures
Similar articles
-
Both iron deficiency and daily iron supplements increase lipid peroxidation in rats.J Nutr. 2000 Mar;130(3):621-8. doi: 10.1093/jn/130.3.621. J Nutr. 2000. PMID: 10702595
-
[Assessment of mitochondrial toxicity induced by zidovudine and adefovir dipivoxil in rats].Zhonghua Gan Zang Bing Za Zhi. 2012 Oct;20(10):794-7. doi: 10.3760/cma.j.issn.1007-3418.2012.10.018. Zhonghua Gan Zang Bing Za Zhi. 2012. PMID: 23207344 Chinese.
-
Normal oxidative damage to mitochondrial and nuclear DNA is extensive.Proc Natl Acad Sci U S A. 1988 Sep;85(17):6465-7. doi: 10.1073/pnas.85.17.6465. Proc Natl Acad Sci U S A. 1988. PMID: 3413108 Free PMC article.
-
Respiratory function decline and DNA mutation in mitochondria, oxidative stress and altered gene expression during aging.Chang Gung Med J. 2009 Mar-Apr;32(2):113-32. Chang Gung Med J. 2009. PMID: 19403001 Review.
-
Beta-carotene breakdown products may impair mitochondrial functions--potential side effects of high-dose beta-carotene supplementation.J Nutr Biochem. 2005 Jul;16(7):385-97. doi: 10.1016/j.jnutbio.2005.01.009. J Nutr Biochem. 2005. PMID: 15992676 Review.
Cited by
-
The Multifaceted Regulation of Mitochondria in Ferroptosis.Life (Basel). 2021 Mar 10;11(3):222. doi: 10.3390/life11030222. Life (Basel). 2021. PMID: 33801920 Free PMC article. Review.
-
Clinical and molecular analysis of a novel variant in heme oxygenase-1 deficiency: Unraveling its role in inflammation, heme metabolism, and pulmonary phenotype.Mol Genet Metab Rep. 2023 Dec 15;38:101038. doi: 10.1016/j.ymgmr.2023.101038. eCollection 2024 Mar. Mol Genet Metab Rep. 2023. PMID: 38178812 Free PMC article.
-
Circulating Reactive Oxygen Species in Adults with Congenital Heart Disease.Antioxidants (Basel). 2022 Nov 30;11(12):2369. doi: 10.3390/antiox11122369. Antioxidants (Basel). 2022. PMID: 36552576 Free PMC article.
-
Iron deficiency in a tertiary gastroenterology center in Romania: prevalence and significancy.J Med Life. 2018 Jan-Mar;11(1):29-35. J Med Life. 2018. PMID: 29696062 Free PMC article.
-
Myeloid-specific deletion of ferroportin impairs macrophage bioenergetics but is disconnected from systemic insulin action in adult mice.Am J Physiol Endocrinol Metab. 2021 Sep 1;321(3):E376-E391. doi: 10.1152/ajpendo.00116.2021. Epub 2021 Aug 2. Am J Physiol Endocrinol Metab. 2021. PMID: 34338042 Free PMC article.
References
-
- World Health Organization. Maternal Health And Safe Motherhood Program, Nutrition Program. Geneva: W.H.O.; 1992. p. 100.
-
- Viteri F E. Nutr Rev. 1997;55:195–209. - PubMed
-
- Looker A C, Dallman P R, Carroll M D, Gunter E W, Johnson C L. J Am Med Assoc. 1997;277:973–976. - PubMed
-
- Yip R. In: Present Knowledge in Nutrition. Bowman B A, Russell R M, editors. Washington, DC: International Life Sciences Institute; 2001. pp. 311–328.
-
- Pollitt E. Annu Rev Nutr. 1993;13:521–537. - PubMed
Publication types
MeSH terms
Substances
Grants and funding
LinkOut - more resources
Full Text Sources
Medical
