Regulation of Kv1 subunit expression in oligodendrocyte progenitor cells and their role in G1/S phase progression of the cell cycle
- PMID: 11854528
- PMCID: PMC122368
- DOI: 10.1073/pnas.042698399
Regulation of Kv1 subunit expression in oligodendrocyte progenitor cells and their role in G1/S phase progression of the cell cycle
Abstract
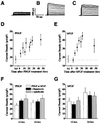
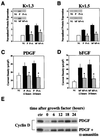
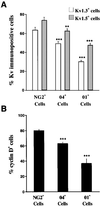
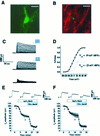
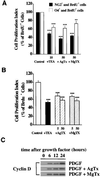
Proliferative oligodendrocyte progenitor cells (OPs) express large, delayed outward-rectifying K(+) currents (I(K)), whereas nondividing immature and mature oligodendrocytes display much smaller I(K). Here, we show that up-regulation of I(K) occurs in G(1) phase of the cell cycle in purified cultured OPs and is the result of an RNA synthesis-dependent, selective increase of the K(+) channel subunit proteins Kv1.3 and Kv1.5. In oligodendrocyte cells acutely isolated from developing rat brain, a decrease of cyclin D expression is observed as these cells mature along their lineage. This is accompanied by a decrease in Kv1.3 and Kv1.5 subunit expression, suggesting a role for these subunits in the proliferative potential of OPs in situ. I(K) expressed in OPs in subventricular zone and developing white matter in acutely isolated slice preparations were selectively blocked by antagonists of Kv1.3, illustrating the functional presence of this subunit in situ. Interestingly, Kv1.3 block inhibited S-phase entry of both purified OPs in culture and in tissue slice cultures. Thus, we employ both in vitro and in situ experimental approaches to show that (i) RNA-dependent synthesis of Kv1.3 and Kv1.5 subunit proteins occurs in G(1) phase of the OP cell cycle and is responsible for the observed increase in I(K), and (ii) currents through Kv1.3-containing channels play a crucial role in G(1)/S transition of proliferating OPs.
Figures

Similar articles
-
Shaker-type potassium channel subunits differentially control oligodendrocyte progenitor proliferation.Glia. 2004 Dec;48(4):337-45. doi: 10.1002/glia.20088. Glia. 2004. PMID: 15390108
-
Adult rat optic nerve oligodendrocyte progenitor cells express a distinct repertoire of voltage- and ligand-gated ion channels.J Neurosci Res. 1995 Apr 1;40(5):591-605. doi: 10.1002/jnr.490400504. J Neurosci Res. 1995. PMID: 7541473
-
Expression of the green fluorescent protein in the oligodendrocyte lineage: a transgenic mouse for developmental and physiological studies.J Neurosci Res. 2002 Nov 15;70(4):529-45. doi: 10.1002/jnr.10368. J Neurosci Res. 2002. PMID: 12404507
-
Developmental regulation of ion channels and receptors on glial cells.Perspect Dev Neurobiol. 1995;2(4):347-56. Perspect Dev Neurobiol. 1995. PMID: 7538867 Review.
-
Targeting the voltage-dependent K(+) channels Kv1.3 and Kv1.5 as tumor biomarkers for cancer detection and prevention.Curr Med Chem. 2012;19(5):661-74. doi: 10.2174/092986712798992048. Curr Med Chem. 2012. PMID: 22204339 Review.
Cited by
-
Ca2+-activated K+ channels in human melanoma cells are up-regulated by hypoxia involving hypoxia-inducible factor-1alpha and the von Hippel-Lindau protein.J Physiol. 2006 Mar 1;571(Pt 2):349-59. doi: 10.1113/jphysiol.2005.096818. Epub 2006 Jan 5. J Physiol. 2006. PMID: 16396931 Free PMC article.
-
Proliferation-related changes in K+ content in human mesenchymal stem cells.Sci Rep. 2019 Jan 23;9(1):346. doi: 10.1038/s41598-018-36922-y. Sci Rep. 2019. PMID: 30674973 Free PMC article.
-
Kv1.3 Controls Mitochondrial Dynamics during Cell Cycle Progression.Cancers (Basel). 2021 Sep 4;13(17):4457. doi: 10.3390/cancers13174457. Cancers (Basel). 2021. PMID: 34503267 Free PMC article.
-
Altered Expression of Ion Channels in White Matter Lesions of Progressive Multiple Sclerosis: What Do We Know About Their Function?Front Cell Neurosci. 2021 Jun 25;15:685703. doi: 10.3389/fncel.2021.685703. eCollection 2021. Front Cell Neurosci. 2021. PMID: 34276310 Free PMC article. Review.
-
Human immunodeficiency virus protein Tat induces oligodendrocyte injury by enhancing outward K+ current conducted by KV1.3.Neurobiol Dis. 2017 Jan;97(Pt A):1-10. doi: 10.1016/j.nbd.2016.10.007. Epub 2016 Nov 2. Neurobiol Dis. 2017. PMID: 27816768 Free PMC article.
References
-
- Levison S W, Goldman J E. Neuron. 1993;10:201–212. - PubMed
-
- Levison S W, Chuang C, Abramson B J, Goldman J E. Development (Cambridge, UK) 1993;119:611–622. - PubMed
-
- Raff M C, Durand B, Gao F B. Int J Dev Biol. 1998;42:263–267. - PubMed
-
- Kettenmann H, Blankenfeld G V, Trotter J. Ann NY Acad Sci. 1991;633:64–77. - PubMed
Publication types
MeSH terms
Substances
LinkOut - more resources
Full Text Sources
Molecular Biology Databases
Miscellaneous

