. 2002 Feb 19;99(4):2380-5.
doi: 10.1073/pnas.032423699.

Ca2+ marks: miniature calcium signals in single mitochondria driven by ryanodine receptors

Affiliations

Ca2+ marks: miniature calcium signals in single mitochondria driven by ryanodine receptors

Pál Pacher et al. Proc Natl Acad Sci U S A. .

Abstract

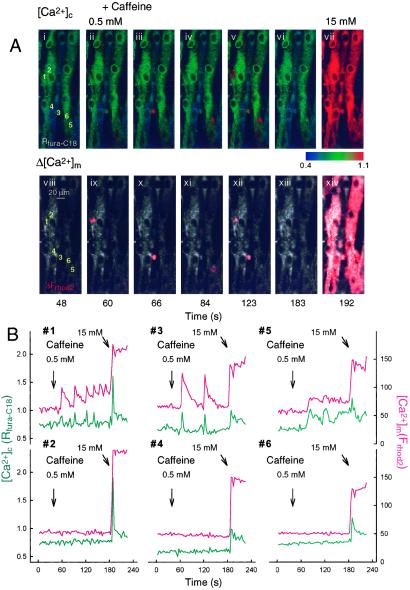
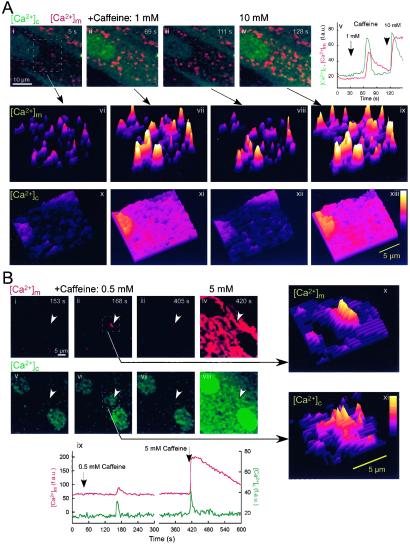
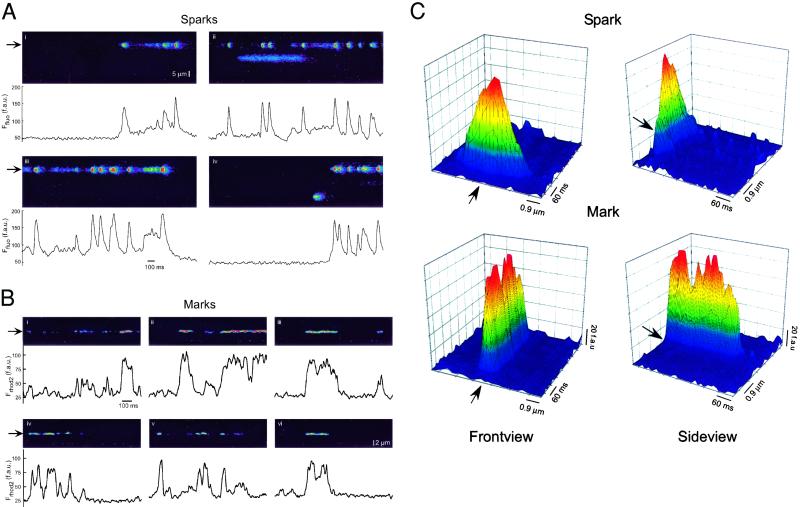
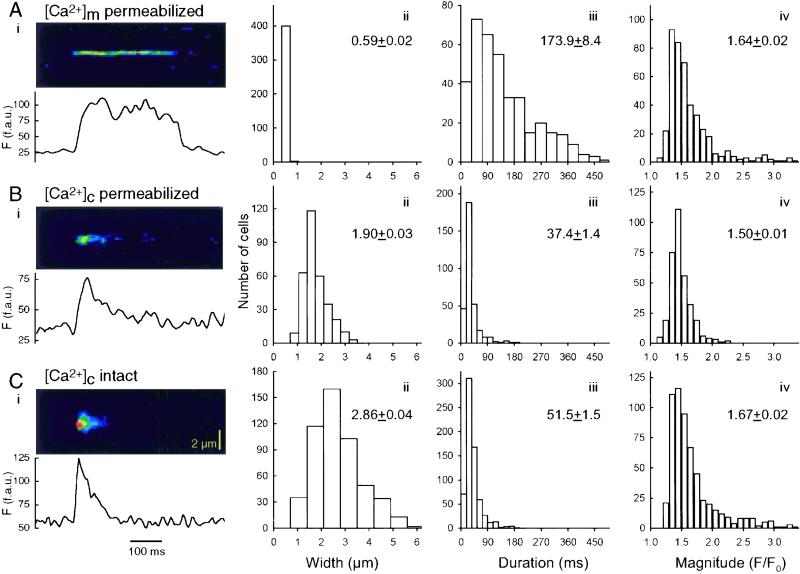
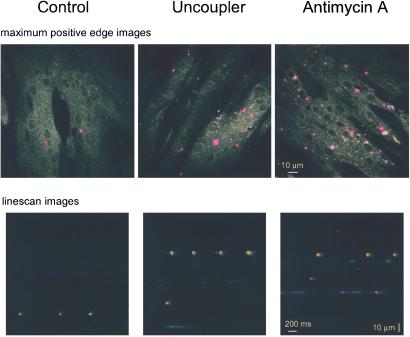
Propagation of cytosolic [Ca(2+)] ([Ca(2+)](c)) signals to the mitochondria is believed to be supported by a local communication between Ca(2+) release channels and adjacent mitochondrial Ca(2+) uptake sites, but the signaling machinery has not been explored at the level of elementary Ca(2+) release events. Here, we demonstrate that [Ca(2+)](c) sparks mediated by ryanodine receptors are competent to elicit miniature mitochondrial matrix [Ca(2+)] signals that we call "Ca(2+) marks." Ca(2+) marks are restricted to single mitochondria and typically last less than 500 ms. The decay of Ca(2+) marks relies on extrusion of Ca(2+) from the mitochondria through the Ca(2+) exchanger, whereas [Ca(2+)](c) sparks decline primarily by diffusion. Mitochondria also appear to have a direct effect on the properties of [Ca(2+)](c) sparks, because inhibition of mitochondrial Ca(2+) uptake results in an increase in the frequency and duration of [Ca(2+)](c) sparks. Thus, a short-lasting opening of a cluster of Ca(2+) release channels can yield activation of mitochondrial Ca(2+) uptake, and the competency of mitochondrial Ca(2+) handling may be an important determinant of cardiac excitability through local feedback control of elementary [Ca(2+)](c) signals.


Figures

Figure 1
Figure 1
Spatially restricted [Ca2+]c and [Ca2+]m spikes evoked by submaximal activation of the RyR. Fluorescence imaging of [Ca2+]c and [Ca2+]m responses evoked by caffeine in rhod2-loaded permeabilized myotubes was performed. (A) The pseudocolor ratio images (340 nm/380 nm; blue, low [Ca2+]; red, high [Ca2+]) in Upper show the changes in fura-C18 fluorescence ([Ca2+]c) after the addition of 0.5 mM (ii–vi) and 15 mM (vii) caffeine. The gray images in Lower show the rhod2 fluorescence ([Ca2+]m), and the red overlays show the fluorescence changes from increased [Ca2+]m at each time point, measured simultaneously with [Ca2+]c. (B) Time courses of [Ca2+]c and [Ca2+]m changes for the numbered regions. Regions were selected in the areas displaying local [Ca2+]c spiking in response to 0.5 mM caffeine (1, 3, 5) and in adjacent regions that exhibited a response only during stimulation with maximal caffeine (2, 4, 6). A [Ca2+]m rise was coupled to every localized [Ca2+]c spike in the selected regions (see graphs).
Figure 2
Figure 2
[Ca2+]m increases exhibited by individual mitochondria during RyR-mediated Ca2+ release. (A) Confocal imaging of [Ca2+]m and [Ca2+]c responses evoked by sequential addition of 1 mM and 10 mM caffeine in a rhod2-loaded permeabilized myotube. [Ca2+]c was measured with fluo3 added to the intracellular buffer. Spatial organization of [Ca2+]m and [Ca2+]c changes in the region marked by the box in image i is presented as a series of three-dimensional plots. Surface plots were obtained by averaging three scans. Caffeine additions of 1 and 10 mM were made at 30 and 118 s, respectively (see graph in v). Global [Ca2+]c responses evoked by submaximal (xi) and maximal (xiii) caffeine resulted in heterogeneous [Ca2+]m increases at the level of single mitochondria (vii, ix). Plots in vi, x, and viii, xii represent the basal state just before addition of 1 and 10 mM caffeine, respectively. (B) Confocal imaging of localized [Ca2+]m and [Ca2+]c responses. Red images (i–iv) show the [Ca2+]m whereas the green images (v–viii) show the [Ca2+]c in permeabilized myotubes stimulated with 0.5 and 5 mM caffeine added at 58 and 415 s, respectively. Time courses of [Ca2+]m and [Ca2+]c at the region of local [Ca2+]m elevation (masked area: ≈1.6 μm × 4 μm) are plotted in red and green, respectively (ix). Spatial organization of the [Ca2+]m and [Ca2+]c rise during stimulation with 0.5 mM caffeine in the region marked by the box in image ii is presented as a three-dimensional plots (x, xi).
Figure 3
Figure 3
[Ca2+]c sparks and [Ca2+]m marks in myotubes. (A) Representative linescan images of [Ca2+]c sparks recorded in a fluo3-loaded myotube exposed to 0.25 mM caffeine. Successive lines are stacked horizontally; therefore, time is on the horizontal axis. Traces show fluorescence time courses for the site marked by the arrow. (B) Linescan images showing [Ca2+]m marks in a rhod2-loaded, permeabilized myotube exposed to 0.25 mM caffeine. Traces show the temporal profile of fluorescence across a 1-μm region of the scan line, indicated by the solid arrow. The apparent plateau phase in some [Ca2+]m increases was not due to saturation of rhod2, because the [Ca2+]rhod2 elevation was larger during global [Ca2+]c waves (not shown). (C) Linescan images of a spark (second event in A, ii) and a mark (first event in B, iii) are presented as three-dimensional surfaces (front view, Left; side view, Right). The arrow indicates the direction of the time line.
Figure 4
Figure 4
Elementary events of the RyR-mediated [Ca2+]c and [Ca2+]m signal. Confocal line scanning was carried out in intact (C) or in permeabilized (A and B) myotubes by using fluo3 to monitor [Ca2+]c (B and C) or rhod2 to monitor [Ca2+]m (A). In all cases, the myotubes were exposed to 0.25 mM caffeine. The linescan images are oriented so that time is on the horizontal axis. Width, duration, and magnitude histograms for the local [Ca2+] transients are also shown (n = 350–550).
Figure 5
Figure 5
Mitochondrial Ca2+ uptake controls [Ca2+]c sparks in intact myotubes. (Upper) Two-dimensional images of localized [Ca2+]c signals recorded in fluo3-loaded myotubes exposed to solvent (Left), FCCP (5 μM, Uncoupler; Center), or antimycin A (5 μM, Right) in the presence of oligomycin. The gray images show the fluo3 fluorescence. The purple overlays show the maximal fluorescence increase for each pixel (maximal positive edge), calculated by subtraction of sequential images in 15 image sequences. Thus, the overlays indicate all regions that displayed [Ca2+]c responses during the image series. (Lower) Linescan images showing [Ca2+]c sparks in fluo3-loaded myotubes exposed to solvent (Left), FCCP (5 μM, Uncoupler; Center), or antimycin A (5 μM, Right) in the presence of oligomycin.

Similar articles

Cited by

References

    1. Parker I, Yao Y. Proc R Soc London Ser B. 1991;246:269–274. - PubMed
    1. Cheng H, Lederer W J, Cannell M B. Science. 1993;262:740–744. - PubMed
    1. Bootman M D, Berridge M J, Lipp P. Cell. 1997;91:367–373. - PubMed
    1. Berridge M J, Bootman M D, Lipp P. Nature (London) 1998;395:645–648. - PubMed
    1. Jaggar J H, Porter V A, Lederer W J, Nelson M T. Am J Physiol Cell Physiol. 2000;278:C235–C256. - PubMed

Publication types