. 2002 Feb 19;99(4):2416-21.
doi: 10.1073/pnas.042677699.

Analysis of MADS box protein-protein interactions in living plant cells

Affiliations

Analysis of MADS box protein-protein interactions in living plant cells

Richard G H Immink et al. Proc Natl Acad Sci U S A. .

Abstract

Over the last decade, the yeast two-hybrid system has become the tool to use for the identification of protein-protein interactions and recently, even complete interactomes were elucidated by this method. Nevertheless, it is an artificial system that is sensitive to errors resulting in the identification of false-positive and false-negative interactions. In this study, plant MADS box transcription factor interactions identified by yeast two-hybrid systems where studied in living plant cells by a technique based on fluorescence resonance energy transfer (FRET). Petunia MADS box proteins were fused to either cyan fluorescent protein or yellow fluorescent protein and transiently expressed in protoplasts followed by FRET-spectral imaging microscopy and FRET-fluorescence lifetime imaging microscopy to detect FRET and hence protein-protein interactions. All petunia MADS box heterodimers identified in yeast were confirmed in protoplasts. However, in contrast to the yeast two-hybrid results, homodimerization was demonstrated in plant cells for three petunia MADS box proteins. Heterodimers were identified between the ovule-specific MADS box protein FLORAL BINDING PROTEIN 11 and members of the petunia FLORAL BINDING PROTEIN 2 subfamily, which are also expressed in ovules, suggesting that these dimers play a role in ovule development. Furthermore, the role of dimerization in translocation of MADS box protein dimers to the nucleus is demonstrated, and the nuclear localization signal of MADS box proteins has been mapped to the N-terminal region of the MADS domain by means of mutant analyses.


Figures
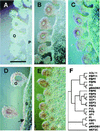
Figure 1
Figure 1
Expression of FBP11 and the genes encoding its interaction partners. Longitudinal sections were hybridized with digoxygenin-labeled probes (red signal). (A) Almost mature W115 wild-type ovules, hybridized with a sense FBP11 probe. (B) Same stage as A, hybridized with an FBP11 antisense probe. (C) Same stage as A, hybridized with an FBP2 antisense probe. (D) Sepal of cauliflower mosaic virus-35S∷FBP11 overexpression plant with ectopic ovule formation on adaxial side, hybridized with an FBP2 antisense probe. The signal in the epidermal cell layer is marked with an arrow. (E) Young developing ovules, hybridized with a PFG antisense probe. (F) Phylogenetic tree of MADS box genes described in this study. As a reference Arabidopsis and petunia MADS box genes with a known function are included. Petunia MADS box genes are in bold. For the comparison of the proteins the MADS box, I region and K box domains were used. AP1, APETALA1; AP3, APETALA3; AG, AGAMOUS; AGL, AGAMOUS-like; FBP, FLORAL BINDING PROTEIN; FUL, FRUITFULL; MEF2C, Myocyte Enhancer Factor 2C; O, ovule; PFG, PETUNIA FLOWERING GENE; PI, PISTILLATA; P, placenta; S, sepal (adaxial side); and SEP, SEPALLATA. [Bar in A = 1.0 mm.]
Figure 2
Figure 2
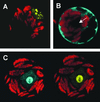
Localization of MADS box proteins in petunia leaf protoplasts imaged by CSLM. Chlorophyll autofluorescence is shown in red. (A) Nuclear-localized FBP9-YFP. (B) Cytoplasmic-localized FBP11-CFP. The position of the nucleus is marked with an arrow. (C) Protoplast expressing FBP11-CFP in combination with FBP2-YFP. (Left) The nuclear-localized CFP signal. (Right) The YFP signal of the same protoplast.
Figure 3
Figure 3
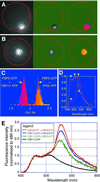
FRET-FLIM and FRET-SPIM analyses of protoplasts expressing petunia MADS box proteins fused to CFP and YFP. (A) Protoplast expressing FBP2-CFP + FBP11-YFP. The border of the protoplast is artificially marked with a red circle. (Left) Fluorescence image of a protoplast. (Center) Fluorescence intensity image (reconstructed from the FLIM-data stack). (Right) Fluorescence lifetime image. The fluorescence lifetime at each pixel is represented in a pseudocolor index. Green represents a mask for pixels with low fluorescence intensity that are excluded from the lifetime analysis, resulting in a lifetime image of the nucleus only. (B) Protoplast expressing FBP2-CFP + PFG-YFP. Left, Center, and Right as described for A. (C) FRET-FLIM analysis. Temporal histogram and pseudocolor scale of the fluorescence pixel values of A and B. (D) FRET-SPIM analysis. Spectra of protoplasts expressing FBP2-CFP + FBP11-YFP (red line) and of protoplasts expressing FBP2-CFP + PFG-YFP (orange line). The CFP emission peaks are marked with a cyan-colored arrowhead, and the YFP emission peaks are marked with yellow arrowheads. (E) FRET-SPIM analyses of petunia protoplasts transfected with FBP11CFP, FBP11CFP + FBP5YFP, FBP11CFP + FBP9YFP, and FBP9CFP + FBP9YFP. The spectrum of one representative protoplast is shown from each transfection.
Figure 4
Figure 4
Role of NLS in MADS box protein translocation. (A) Representation of MADS box protein structure and the predicted position of NLSs. The bipartite NLS localized in the N-terminal MADS domain is marked blue, and conserved basic amino acids in the MADS domain are marked in green. I, intervening region; K, K-box; C, C-terminal region. All images (BF) were obtained by CSLM. Chlorophyll autofluorescence is shown in red. (B) Localization of FBP11-CFP (Left) and FBP11ΔN-CFP (Right). (C) Localization of FBP2-YFP (Left) and FBP2ΔN-YFP (Right). (D) Nuclear colocalization of FBP11-CFP and FBP2-YFP. (Left) The CFP signal. (Right) The YFP signal of the same protoplast. (E) Cytoplasmic colocalization of FBP11ΔN-CFP and FBP2-YFP. (Left) The CFP signal. (Right) The YFP signal of the same protoplast. (F) Colocalization of FBP11-CFP and FBP2ΔNLS-YFP. (Left) The CFP signal. (Right) The YFP signal of the same protoplast. The nucleus is marked with an arrow.

References

    1. Fashena S J, Serebriiskii I, Golemis E A. Gene. 2000;250:1–14. - PubMed
    1. Uetz P, Giot L, Cagney G, Mansfield T A, Judson R S, Knight J R, Lockshon D, Narayan V, Srinivasan M, Pochart P, et al. Nature (London) 2000;403:623–627. - PubMed
    1. Ito T, Chiba T, Ozawa R, Yoshida M, Hattor M, Sakaki Y. Proc Natl Acad Sci USA. 2001;98:4569–4574. - PMC - PubMed
    1. Stryer L. Annu Rev Biochem. 1978;47:819–846. - PubMed
    1. Wu P, Brand L. Anal Biochem. 1994;218:1–13. - PubMed

MeSH terms

Associated data

LinkOut - more resources