Pharmacological characterization of the chemokine receptor, CCR5
- PMID: 11861332
- PMCID: PMC1573204
- DOI: 10.1038/sj.bjp.0704540
Pharmacological characterization of the chemokine receptor, CCR5
Abstract
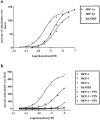
1. We investigated the effects of a number of naturally occurring chemokines (MIP-1alpha, MIP-1beta, RANTES, MCP-2, MCP-3, MCP-4) on different processes linked to the chemokine receptor CCR5 in recombinant CHO cells expressing the receptor at different levels. 2. Internalization of CCR5 following chemokine treatment was studied and MIP-1alpha, MIP-1beta and RANTES (50 nM) were able to induce internalization (similar50%) of the receptor. Internalization due to MCP-2, MCP-3 and MCP-4 was less (similar20%). 3. Phosphorylation of CCR5 following chemokine treatment was studied and MIP-1alpha, MIP-1beta and RANTES (50 nM) were able to induce phosphorylation of CCR5 whereas the other chemokines did not induce CCR5 phosphorylation. 4. MIP-1alpha, MIP-1beta, RANTES and MCP-2 were able to stimulate [(35)S]-GTPgammaS binding, an index of receptor/G protein activation, whereas MCP-3 and MCP-4 had no effect in this assay. MCP-2 was a partial agonist (similar80%) compared to MIP-1alpha, MIP-1beta and RANTES, which gave similar maximal stimulations in this assay. 5. MIP-1alpha, MIP-1beta, RANTES, MCP-2 and MCP-4 were able to stimulate increases in intracellular calcium ions via activation of CCR5 whereas MCP-3 was without effect. 6. It is concluded that different chemokines interacting with CCR5 mediate different patterns of cellular responses.
Figures


Similar articles
-
Analysis of second messenger pathways stimulated by different chemokines acting at the chemokine receptor CCR5.Biochem Pharmacol. 2007 Sep 15;74(6):881-90. doi: 10.1016/j.bcp.2007.06.019. Epub 2007 Jun 20. Biochem Pharmacol. 2007. PMID: 17645873
-
Increased responsiveness of murine eosinophils to MIP-1beta (CCL4) and TCA-3 (CCL1) is mediated by their specific receptors, CCR5 and CCR8.J Leukoc Biol. 2002 Jun;71(6):1019-25. J Leukoc Biol. 2002. PMID: 12050188
-
Molecular anatomy of CCR5 engagement by physiologic and viral chemokines and HIV-1 envelope glycoproteins: differences in primary structural requirements for RANTES, MIP-1 alpha, and vMIP-II Binding.J Mol Biol. 2001 Nov 9;313(5):1181-93. doi: 10.1006/jmbi.2001.5086. J Mol Biol. 2001. PMID: 11700073
-
[Eosinophils and related chemokines].Rinsho Byori. 2001 Apr;49(4):370-5. Rinsho Byori. 2001. PMID: 11391951 Review. Japanese.
-
Chemokines as regulators of T cell differentiation.Nat Immunol. 2001 Feb;2(2):102-7. doi: 10.1038/84205. Nat Immunol. 2001. PMID: 11175801 Review.
Cited by
-
Lack of prophylactic efficacy of oral maraviroc in macaques despite high drug concentrations in rectal tissues.J Virol. 2013 Aug;87(16):8952-61. doi: 10.1128/JVI.01204-13. Epub 2013 Jun 5. J Virol. 2013. PMID: 23740994 Free PMC article.
-
RANTES modulates the release of glutamate in human neocortex.J Neurosci. 2008 Nov 19;28(47):12231-40. doi: 10.1523/JNEUROSCI.3212-08.2008. J Neurosci. 2008. PMID: 19020017 Free PMC article.
-
Pro-Inflammatory Chemokines CCL5, CXCL12, and CX3CL1 Bind to and Activate Platelet Integrin αIIbβ3 in an Allosteric Manner.Cells. 2022 Sep 29;11(19):3059. doi: 10.3390/cells11193059. Cells. 2022. PMID: 36231020 Free PMC article.
-
Metal ions and nanomaterials for targeted bone cancer immunotherapy.Front Immunol. 2025 Mar 17;16:1513834. doi: 10.3389/fimmu.2025.1513834. eCollection 2025. Front Immunol. 2025. PMID: 40165969 Free PMC article. Review.
-
Substance P (SP) enhances CCL5-induced chemotaxis and intracellular signaling in human monocytes, which express the truncated neurokinin-1 receptor (NK1R).J Leukoc Biol. 2009 Jan;85(1):154-64. doi: 10.1189/jlb.0408260. Epub 2008 Oct 3. J Leukoc Biol. 2009. PMID: 18835883 Free PMC article.
References
-
- ALKHATIB G., COMBADIERE C., BRODER C.C., FENG Y., KENNEDY P.E., MURPHY P.M., BERGER E.A. CC CKR5: a RANTES, MIP-1 alpha, MIP-1 beta receptor as a fusion cofactor for macrophage-tropic HIV-1. Science. 1996;272:1955–1958. - PubMed
-
- ALKHATIB G., LOCATI M., KENNEDY P.E., MURPHY P.M., BERGER E.A. HIV-1 coreceptor activity of CCR5 and its inhibition by chemokines: independence from G protein signaling and importance of coreceptor downmodulation. Virology. 1997;234:340–348. - PubMed
-
- AMARA A., GALL S.L., SCHWARTZ O., SALAMERO J., MONTES M., LOETSCHER P., BAGGIOLINI M., VIRELIZIER J.L., ARENZANA-SEISDEDOS F. HIV coreceptor downregulation as antiviral principle: SDF-1 alpha-dependent internalization of the chemokine receptor CXCR4 contributes to inhibition of HIV replication. J. Exp. Med. 1997;186:139–146. - PMC - PubMed
-
- BAGGIOLINI M., DEWALD B., MOSER B. Interleukin-8 and related chemotactic cytokines-CXC and CC chemokines. Adv. Immunol. 1994;55:97–179. - PubMed
-
- BAGGIOLINI M., DEWALD B., MOSER B. Human chemokines: an update. Ann. Rev. Immunol. 1997;15:675–705. - PubMed
Publication types
MeSH terms
Substances
LinkOut - more resources
Full Text Sources
Other Literature Sources
Miscellaneous

