. 2002 Mar;76(6):2703-13.
doi: 10.1128/jvi.76.6.2703-2713.2002.

Mouse model for the equilibration interaction between the host immune system and human T-cell leukemia virus type 1 gene expression

Affiliations

Mouse model for the equilibration interaction between the host immune system and human T-cell leukemia virus type 1 gene expression

Rika A Furuta et al. J Virol. 2002 Mar.

Abstract

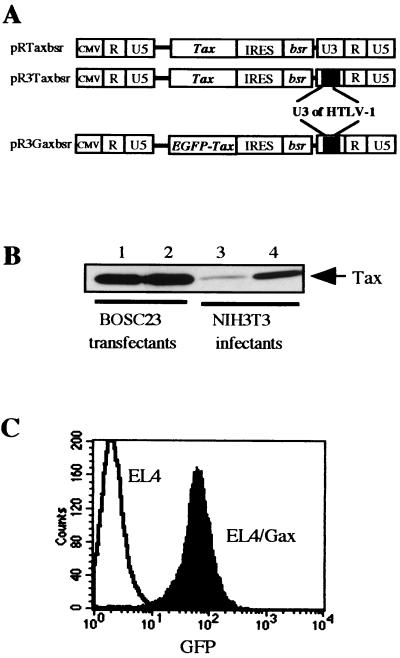
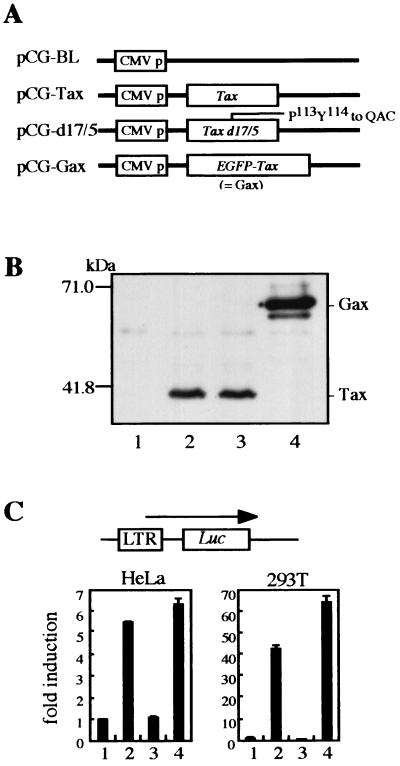
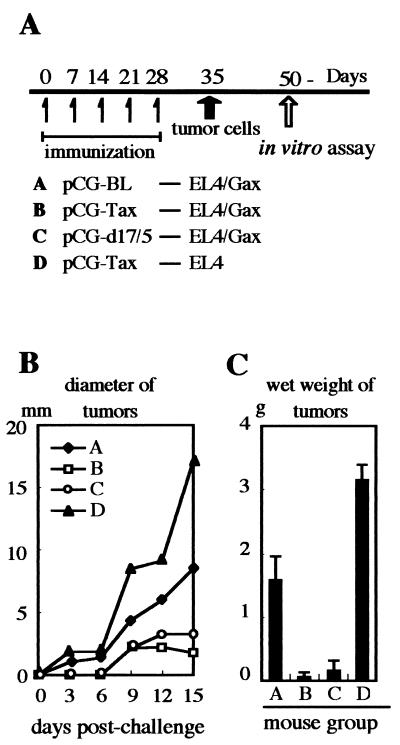
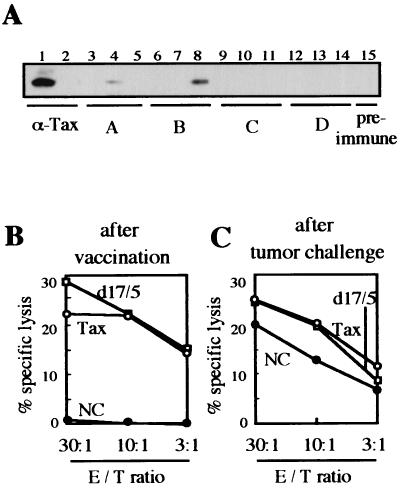
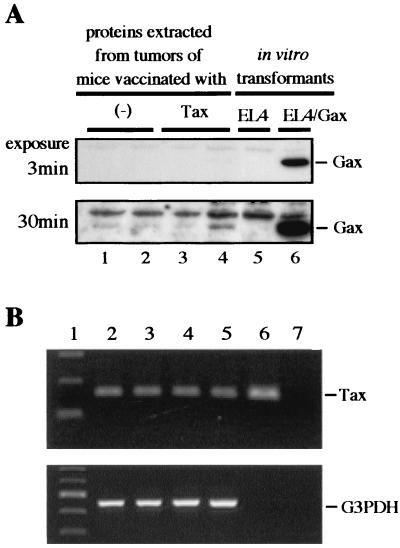
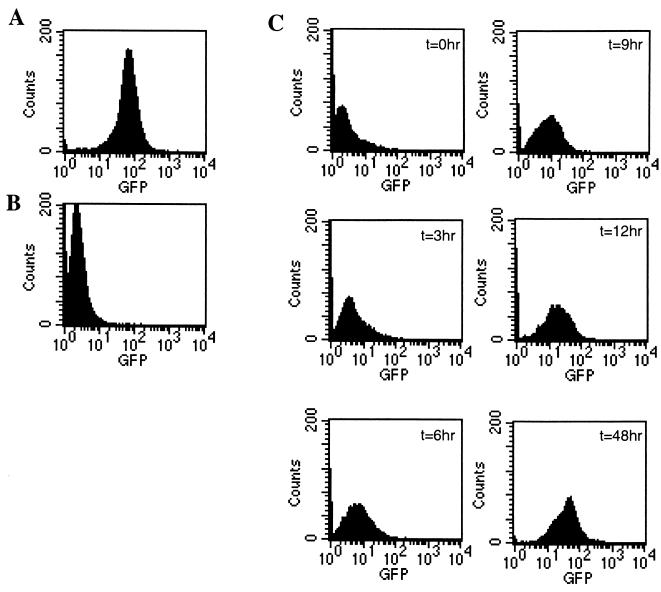
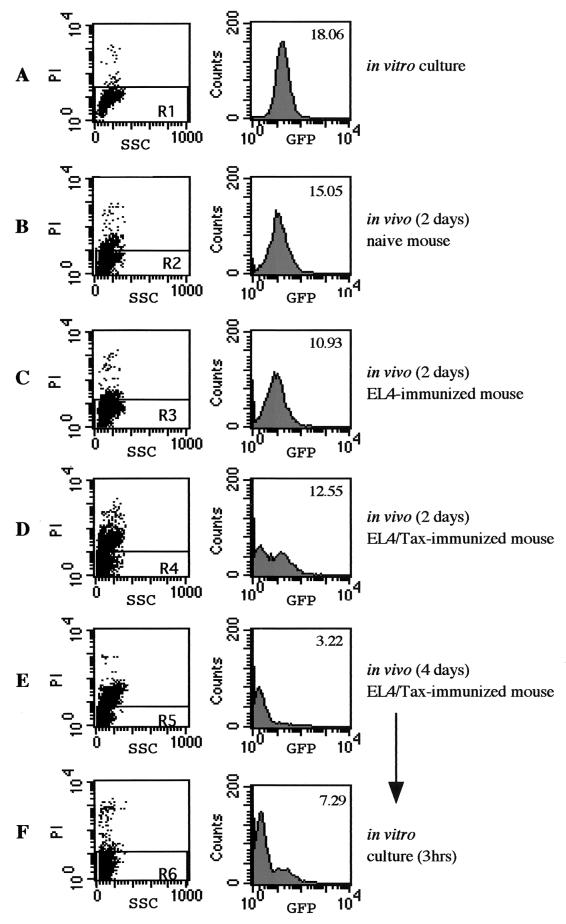
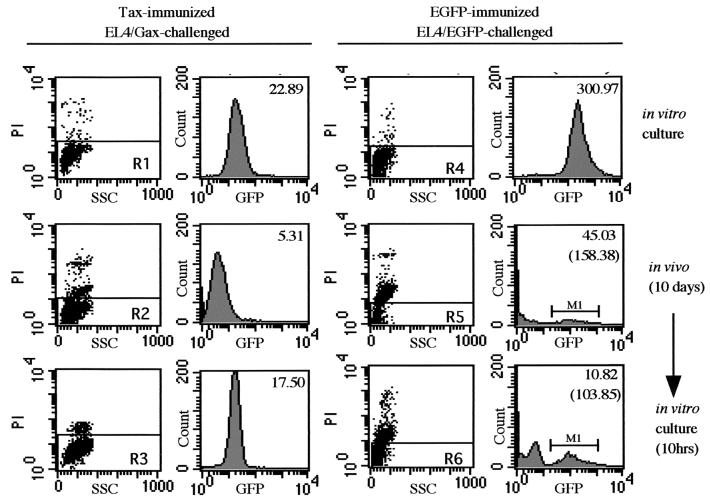
To study the involvement of immune responses against Tax of human T-cell leukemia virus type 1 (HTLV-1) in the growth of and gene suppression in Tax-expressing tumor cells in vivo, we established a model system involving C57BL/6J mice and a syngeneic lymphoma cell line, EL4. When mice were immunized by DNA-based immunization with Tax expression plasmids, solid tumor formation upon subcutaneous inoculation of EL4 cells expressing green fluorescent protein-fused Tax (Gax) under the control of the HTLV-1 enhancer was strongly inhibited, and in vitro analysis showed that DNA immunization elicited cytotoxic T-lymphocyte (CTL) responses but not production of antibodies to Tax protein. Since EL4/Gax cells inoculated into DNA-immunized mice were not completely eradicated but were maintained as small solid tumors for a long period, there appeared to be a certain equilibrium between CTL activity and the growth of Gax-expressing cells. With such a balance, expression of the Gax gene in EL4/Gax cells was strongly suppressed. These results suggested that gene expression under the control of the HTLV-1 long terminal repeat and Tax is silenced in vivo, resulting in an equilibrium between viral expression and the host immune system. Such a balance would represent a status of persistent infection by HTLV-1 in virus-infected individuals during the latency period.


Figures

FIG. 1.
FIG. 1.
(A) Design of retrovirus vectors. The parental vector, pRTaxbsr, has a cytomegalovirus enhancer/promoter unit (CMV p) at the 5′ end, cDNA of Tax linked with a drug resistance gene, bsr, by an IRES, and an MLV LTR at the 3′ end. The 273-bp U3 region of MLV LTR was replaced by a 266-bp fragment of HTLV-1 LTR, resulting in pR3Taxbsr. Then cDNA of EGFP was fused with tax cDNA at the 5′ end, resulting in pR3Gaxbsr. (B) The protein expression of the pR and pR3 vectors was compared by Western blotting using an anti-Tax rabbit antiserum. BOSC23 cells were transfected with either pRTaxbsr or pR3Taxbsr by using Lipofectamine. NIH 3T3 cells were infected with the same titer of a supernatant of transfected BOSC23 cells. Proteins were harvested 50 h posttransfection and 48 h postinfection. Three micrograms of transfected BOSC23 cell lysates (lanes 1 and 2) and 17 μg of infected NIH 3T3 cell lysates (lanes 3 and 4) were analyzed by SDS-12% PAGE, blotted onto PVDF membranes, and then probed with a rabbit antiserum against the C terminus of Tax. (C) Establishment a mouse lymphoma cell line expressing Gax. EL4 cells were infected with pR3Gaxbsr virus, selected with Blasticidin S, cloned by limiting dilution, and then sorted as to EGFP intensity. The Gax-expressing cell line was established and named EL4/Gax. We also established EL4/Tax and EL4/EGFP cell lines by infection with RTaxbsr and REGFP viruses, respectively (data not shown).
FIG. 2.
FIG. 2.
DNA vaccine of HTLV-1 Tax and its mutant. (A) Schematic diagram of the expression vectors used for DNA immunization. The eukaryotic expression vector pCG-BL expresses no structural proteins. Wild-type and mutant tax cDNAs were inserted into pCG-BL, resulting in pCG-Tax, pCG-d17/5, and pCG-Gax. In pCG-d17/5, the 113Pro-114Tyr sequence was changed to Gln-Asp-Cys. (B) Protein expression from each vector in human kidney 293T cells. Cells were transfected with pCG-BL (lane 1), pCG-Tax (lane 2), pCG-d17/5 (lane 3), or pCG-Gax (lane 4), and then Western blot analysis was performed as described in the legend to Fig. 1. (C) Transactivation of the HTLV-1 LTR by Tax or Tax mutants. Either HeLa (left) or 293T (right) cells were cotransfected with pLTR-Luc, which is an HTLV-1 LTR reporter plasmid, and one of the pCG vectors by using Lipofectamine. Lanes correspond to those in panel B. Two days posttransfection, cells were lysed and luciferase activity was measured. Data shown are averages for three independent transfections.
FIG. 3.
FIG. 3.
(A) Mice were placed in four groups, A to D, and immunized with 50 μg of pCG vector 5 times by i.m. injection. Mice in group A were immunized with pCG-BL. In groups B and D, mice were vaccinated with pCG-Tax, while mice in group D were challenged with control tumor cells, EL4, after immunization. Mice in group C were immunized with a vector expressing the Tax null mutant d17/5. All mice in groups B to D were also injected with 10 μg of a GM-CSF-expressing vector and a CpG oligonucleotide. Two weeks after five DNA injections, mice were challenged s.c. with 5 × 10⁵ lymphoma cells. (B) The diameters of tumors at the injection sites were determined by using vernier calipers on the indicated days after challenge with EL4/Gax or EL4 cells. Data represent averages for five mice. (C) Wet weights of tumors taken from sacrificed mice 50 to 52 days postimmunization (about 2 weeks after tumor challenge) were determined. Mouse groups correspond to those in panel A.
FIG. 4.
FIG. 4.
Humoral and cellular immune responses determined in vitro for DNA-immunized and EL4/Gax-challenged mice. (A) Sera were collected from three mice in each group and one preimmune mouse. 293T cells were transfected with pCG-Gax with Lipofectamine, and then cell lysates were used for blotting with Gax antigen. A lysate from nontransfected cells was used in lane 2. Sera used for blotting were as follows: lanes 1 and 2, anti-Tax rabbit antiserum; lanes 3 to 5, mice in group A (pCG-BL vaccinated and EL4/Gax challenged); lanes 6 to 8, mice in group B (pCG-Tax vaccinated and EL4/Gax challenged); lanes 9 to 11, mice in group C (pCG-d17/5 vaccinated and EL4/Gax challenged); lanes 12 to 14, mice in group D (pCG-Tax vaccinated and EL4 challenged); lane 15, preimmune mouse. (B and C) CTL responses to EL4/Gax cells were determined with different effector/target (E/T) ratios at 7 days after DNA immunization (B) and 15 days after EL4/Gax cell challenge (C). T cells purified from splenocytes of mice from groups A (NC), B (Tax), and C (d17/5) were incubated for 3 days with syngeneic dendritic cells transfected with pCG-Tax by using Lipofectamine. Subsequently, CTL activity against EL4/Gax cells was determined by means of a 5-h 51Cr release assay.
FIG. 5.
FIG. 5.
Expression of Gax in vivo. In this experiment, mice were immunized with either pCG-BL (−) or pCG-Tax (Tax), with the schedules described in the legend to Fig. 3A. Solid tumors formed by EL4/Gax cells in mice were removed, and then proteins and RNAs were extracted as described in Materials and Methods. (A) Western blotting with anti-Tax serum. Two samples from each group (lanes 1 to 4) were analyzed. As negative and positive controls, respectively, lysates from cultured EL4 (lane 5) and EL4/Gax (lane 6) cells were blotted. The upper panel shows results with a 3-min film exposure, while the lower panel shows results with a 30-min exposure. (B) RT-PCR of RNA samples from tumors. Lane 1, size markers. RNAs used for RT-PCR were derived from tumors in mice vaccinated with pCG-BL (lane 2), pCG-Tax (lane 3), or pCG-d17/5 (lane 4), or from in vitro EL4/Gax cell cultures (lanes 5 and 7). In lane 6, pR3Gaxbsr was used as a positive control. In lane 7, RT-PCR was performed without reverse transcriptase as a negative control. In the upper panel, a PCR primer set was used to detect Tax, while in the lower panel, PCR was performed with another primer set to detect mouse G3PDH as an internal control.
FIG. 6.
FIG. 6.
Protein expression of EL4/Gax cells in ascitic fluid. Mice were vaccinated with 50 μg of pCG-d17/5, 10 μg of a GM-CSF expression vector, and 10 μg of a CpG oligonucleotide four times weekly. Two weeks after the last immunization, 104 EL4/Gax cells were i.p. injected. EL4/Gax cells were collected from ascitic fluids and transferred to in vitro conditions at 3 weeks after challenge. Expression of Gax proteins was analyzed before challenge (A) and just after collection from ascitic fluids (B). (C) Reversion of Gax expression after transfer to in vitro conditions. From the time point just after collection of cells from the peritoneal cavity (t = 0 h), Gax expression was analyzed by flow cytometry every 3 h. Gax expression started to show reactivation in 3 h and reached a level almost equivalent with that before in vivo incubation within 12 h.
FIG. 7.
FIG. 7.
Effects of the immune responses on Gax gene suppression in vivo. C57BL/6J mice were immunized by s.c. injection of either saline (B), 105 EL4 cells (C), or 105 EL4/Tax cells (D and E) cells 2 weeks before i.p. challenge with 2 × 10⁷ EL4/Gax cells. Cells were harvested from an in vitro culture (A), from mice 2 days (B to D) or 4 days (E) after challenge, and after 3 h of in vitro culture following 4 days of incubation in the peritoneal cavity (F). The collected cells were stained with PI and then subjected to flow cytometry analysis. (Left panels) PI staining; (right panels) histograms of GFP fluorescence of the PI-negative population (R1 to R6). Numbers in the right panel indicate mean fluorescence.
FIG. 8.
FIG. 8.
Gene suppression of EGFP. C57BL6 mice were immunized by s.c. injection of either 105 EL4/Tax cells (left) or 105 EL4/EGFP cells (right) 2 weeks before i.p. challenge with 2 × 10⁷ EL4/Gax (left) or EL4/EGFP (right) cells. Cells were collected from an in vitro culture (top), just after 10 days of incubation in the peritoneal cavity (middle), or after 10 h of in vitro culture following 10 days of incubation in the peritoneal cavity (bottom). GFP fluorescence was analyzed in the PI-negative population (R1 to R6). Top numbers in histograms indicate mean fluorescence, and numbers in parentheses indicate the mean fluorescence of the M1 region.

Similar articles

Cited by

References

    1. Abe, J., H. Wakimoto, Y. Yoshida, M. Aoyagi, K. Hirakawa, and H. Hamada. 1995. Antitumor effect induced by granulocyte/macrophage colony-stimulating factor gene-modified tumor vaccination: comparison of adenovirus- and retrovirus-mediated genetic transduction. J. Cancer Res. Clin. Oncol. 121:587-592. - PubMed
    1. Ballard, D. W., E. Bohnlein, J. W. Lowenthal, Y. Wano, B. R. Franza, and W. C. Greene. 1988. HTLV-I tax induces cellular proteins that activate the κB element in the IL-2 receptor α gene. Science 241:1652-1655. - PubMed
    1. Bangham, C. R., S. Daenke, R. E. Phillips, J. K. Cruickshank, and J. I. Bell. 1988. Enzymatic amplification of exogenous and endogenous retroviral sequences from DNA of patients with tropical spastic paraparesis. EMBO J. 7:4179-4184. - PMC - PubMed
    1. Cann, A. J., J. D. Rosenblatt, W. Wachsman, N. P. Shah, and I. S. Chen. 1985. Identification of the gene responsible for human T-cell leukaemia virus transcriptional regulation. Nature 318:571-574. - PubMed
    1. Chen, I. S., A. J. Cann, N. P. Shah, and R. B. Gaynor. 1985. Functional relation between HTLV-II x and adenovirus E1A proteins in transcriptional activation. Science 230:570-573. - PubMed

Publication types

MeSH terms

LinkOut - more resources