

Analysis of similarity within 142 pairs of orthologous intergenic regions of Caenorhabditis elegans and Caenorhabditis briggsae
- PMID: 11861916
- PMCID: PMC101251
- DOI: 10.1093/nar/30.5.1233
Analysis of similarity within 142 pairs of orthologous intergenic regions of Caenorhabditis elegans and Caenorhabditis briggsae
Abstract
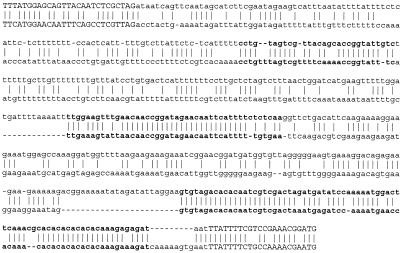
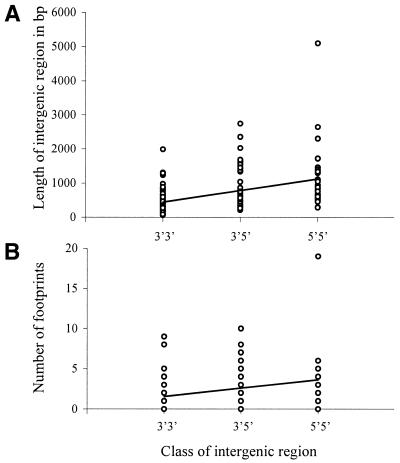
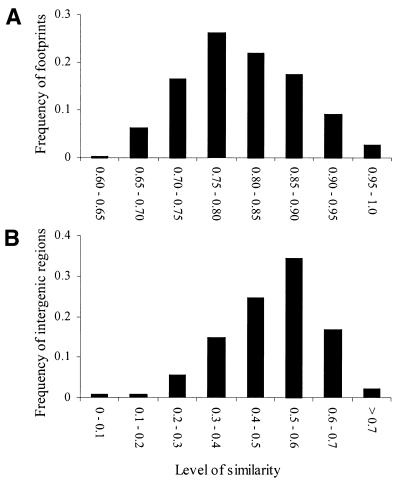
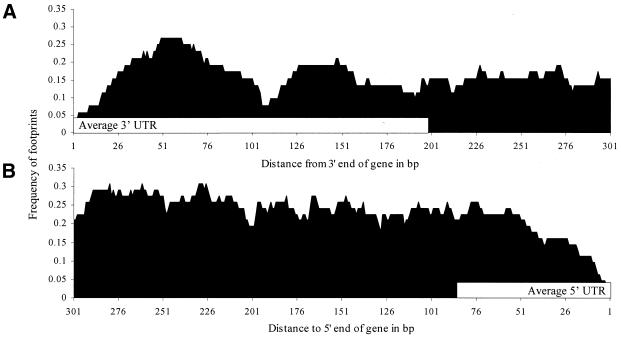
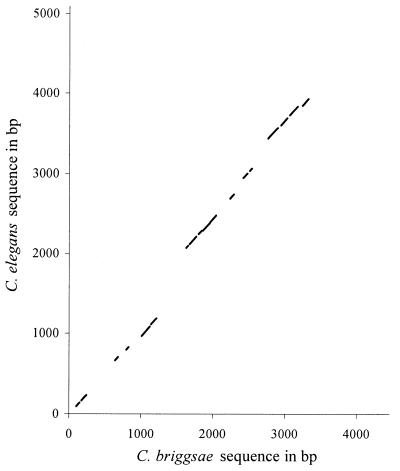
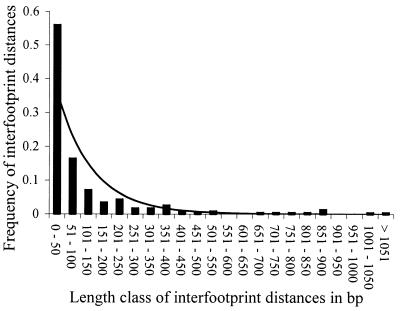
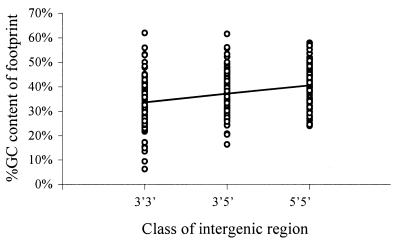
Patterns of similarity between genomes of related species reflect the distribution of selective constraint within DNA. We analyzed alignments of 142 orthologous intergenic regions of Caenorhabditis elegans and Caenorhabditis briggsae and found a mosaic pattern with regions of high similarity (phylogenetic footprints) interspersed with non-alignable sequences. Footprints cover approximately 20% of intergenic regions, often occur in clumps and are rare within 5' UTRs but common within 3' UTRs. The footprints have a higher ratio of transitions to transversions than expected at random and a higher GC content than the rest of the intergenic region. The number of footprints and the GC content of footprints within an intergenic region are higher when genes are oriented so that their 5' ends form the boundaries of the intergenic region. Overall, the patterns and characteristics identified here, along with other comparative and experimental studies, suggest that many footprints have a regulatory function, although other types of function are also possible. These conclusions may be quite general across eukaryotes, and the characteristics of conserved regulatory elements determined from genomic comparisons can be useful in prediction of regulation sites within individual DNA sequences.
Figures
References
-
- Tautz D. (2000) Evolution of transcriptional regulation. Curr. Opin. Genet. Dev., 10, 575–579. - PubMed
-
- Kimura M. (1983) The Neutral Theory of Molecular Evolution. Cambridge University Press, New York.
-
- Shabalina S.A. and Kondrashov,A.S. (1999) Pattern of selective constraint in C. elegans and C. briggsae genomes. Genet. Res., 74, 23–30. - PubMed
-
- Kent W.J. and Zahler,A.M. (2000) Conservation, regulation, synteny, and introns in a large-scale C. briggsae-C. elegans genomic alignment. Genome Res., 10, 1115–1125. - PubMed
-
- Bergman C.M. and Kreitman,M. (2001) Analysis of conserved noncoding DNA in Drosophila reveals similar structural and evolutionary properties of intergenic and intronic sequences. Genome Res., 11, 1335–1345. - PubMed
Publication types
MeSH terms
Substances
LinkOut - more resources
Full Text Sources
Miscellaneous
