. 2002 Mar 1;30(5):1268-77.
doi: 10.1093/nar/30.5.1268.

BALSA: Bayesian algorithm for local sequence alignment

Affiliations

BALSA: Bayesian algorithm for local sequence alignment

Bobbie-Jo M Webb et al. Nucleic Acids Res. .

Abstract

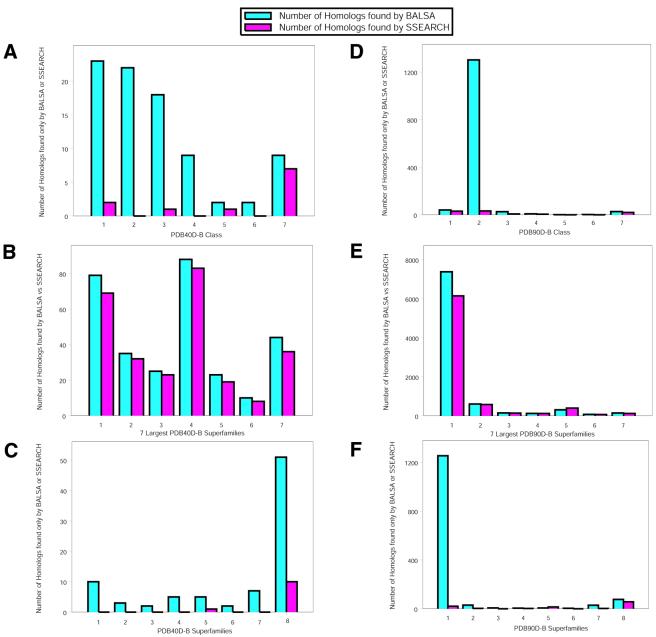
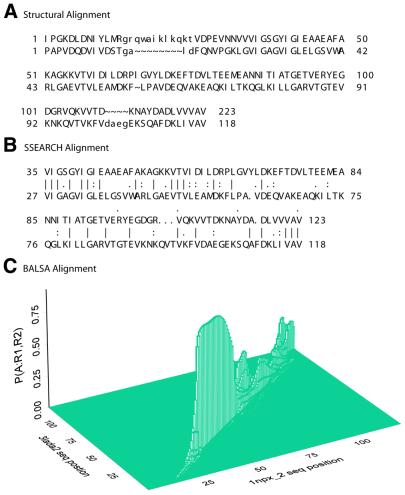
The Smith-Waterman algorithm yields a single alignment, which, albeit optimal, can be strongly affected by the choice of the scoring matrix and the gap penalties. Additionally, the scores obtained are dependent upon the lengths of the aligned sequences, requiring a post-analysis conversion. To overcome some of these shortcomings, we developed a Bayesian algorithm for local sequence alignment (BALSA), that takes into account the uncertainty associated with all unknown variables by incorporating in its forward sums a series of scoring matrices, gap parameters and all possible alignments. The algorithm can return both the joint and the marginal optimal alignments, samples of alignments drawn from the posterior distribution and the posterior probabilities of gap penalties and scoring matrices. Furthermore, it automatically adjusts for variations in sequence lengths. BALSA was compared with SSEARCH, to date the best performing dynamic programming algorithm in the detection of structural neighbors. Using the SCOP databases PDB40D-B and PDB90D-B, BALSA detected 19.8 and 41.3% of remote homologs whereas SSEARCH detected 18.4 and 38% at an error rate of 1% errors per query over the databases, respectively.


Figures

Figure 1
Figure 1
BALSA allows multiple matrices and gap parameters to be input, returning the posterior distribution over all selected parameters, P(Θ, Λ │ R(1), R(2)). Four matrix gap parameter pairs, BLOSUM matrix/λoe, were chosen based on their performance on sample data: (i) 45/–12/–1, (ii) 50/–12/–2, (iii) 62/–10/–1 and (iv) 62/–12/–1. This histogram of the exact posterior distribution probabilities demonstrates that the selection of scoring matrix and gap parameters is highly dependent upon the given sequences.
Figure 2
Figure 2
The denominator of the likelihood, , does not depend on amino acid sequences of the proteins. The plot of the denominator versus a pair of sequences increases as their lengths increase, inherently correcting for sequence length with the algorithm.
Figure 3
Figure 3
The plot of the score from BALSA versus log(Length1*Length2) returns a correlation coefficient of 0.01431 from the least-squares analysis. This demonstrates that there is little dependence of score on the lengths of sequences 1 and 2, respectively.
Figure 4
Figure 4
Coverage versus EPQ plots of BALSA with the four given matrix gap parameter pairs and SSEARCH with optimal gap parameters and E()-values. BALSA obtained a larger coverage, detection of more homologous pairs, than SSEARCH at all EPQ levels for PDB40D-B, PDB90D-B and PDB41-90D-B.
Figure 5
Figure 5
The comparison of BALSA and SSEARCH at the class and superfamily levels was performed using the optimal set of parameters for SSEARCH, BLOSUM 45 with a gap opening penalty of –12 and gap extension penalty of –1. (A) The number of homologs in each class found only by BALSA or SSEARCH for PDB40D-B. These seven classes are defined as: (1) all α proteins, (2) all β proteins, (3) α / β proteins, (4) α + β proteins, (5) multi-domain proteins, (6) membrane and cell surface proteins and (7) small proteins. There are 226, 318, 322, 246, 37, 27 and 147 proteins, and 610, 1797, 1351, 314, 49, 112 and 289 structural homologs defined for each class, respectively. BALSA finds 85 structural neighbors not detected by SSEARCH and SSEARCH finds 11 not identified by BALSA. This refined view shows the levels at which classes are contributing to the increase of BALSA over SSEARCH. It does not appear that any class is contributing more substantially than would be expected in the database. The most striking feature is that over half of the extra homologs for SSEARCH belong to the seventh class, small proteins. (B) The number of homologous pairs that belong to the seven largest superfamilies, the level at which homology is defined, for the two algorithms on PDB40D-B. For PDB40D-B, 45.2% of homologous pairs in the database belong to one of these superfamilies: (1) immunoglobulins (18.1%); (2) NAP (P)-binding Rossman-fold domains (7.8%); (3) trans glycosidases (5.6%); (4) trypsin-like serine proteases (4.2%); (5) FAD/NAP (P)-binding domain (3.8%); (6) cupredoxins (3.0%); and (7) globin-like (2.7%). Since a large majority of the structural neighbors belong to seven of the 474 superfamilies in PDB40D-B, this figure gives a more detailed view of potential bias in the database that may have yielded the increase in coverage observed by BALSA. In the case of PDB40D-B, BALSA detects slightly more homologs in each of these seven superfamilies than SSEARCH, but not more than would be expected in the database. (C) The number of homologous pairs identified by only BALSA or SSEARCH for each of the seven largest superfamilies and the remaining 467 superfamilies, the eighth category. This refined view at the superfamily level does not give useful information for SSEARCH since only one of the 11 unique homologs belong to one of these seven superfamilies. In the case of BALSA, 34 of the 85 unique homologs, 40.0%, is less than the proportion in PDB40D-B, 45.2%. Additionally, no single superfamily has a substantially larger proportion of these 34 structural neighbors than would be expected in the database. Additionally, as seen in the eighth category, the largest gain is in the proteins that do not belong to the largest seven superfamilies. (D) The number of homologs in each class found only by BALSA or SSEARCH for PDB90D-B. The classes are defined as identical to (A). PDB90D-B has 348, 620, 428, 362, 46, 33 and 242 proteins, and 2211, 19529, 3089, 936, 89, 183 and 952 structural homologs defined for each class, respectively. BALSA finds 1412 homologous pairs not identified by SSEARCH and SSEARCH finds 100 not detected by BALSA. For PDB90D-B, the majority of the homologs unique to BALSA fall into the second class. (E) The number of homologous pairs that belong to the seven largest superfamilies for the two algorithms on PDB90D-B. These seven superfamilies made up 76.1% of all homologous pairs in the database: (1) immunoglobulins (57.8%); (2) trypsin-like serine proteases (4.4%); (3) viral coal and capsid proteins (4.2%); (4) NAP (P)-binding Rossman-fold domains (3.5%); (5) globin-like (2.8%); (6) trans glycosidases (2.0%); and (7) EF-hand (1.4%). Unlike (B), we do see a substantial difference between BALSA and SSEARCH in the first superfamily, the immunoglobulins. The immunoglobulins make up 57.8% of the homologs in PDB90D-B and 66.0% of the homologs found by BALSA belong to this superfamily. (F) The number of homologous pairs detected only by BALSA or SSEARCH for each of the seven largest superfamilies and the remaining superfamilies. For BALSA, 1335 of the 1412 unique homologs belong to one of these superfamilies and 43 of the 100 for SSEARCH. The difference seen in (D) is more evident, a large proportion of the homologs unique to BALSA, 88.8%, do belong to one single superfamily, the immunoglobulins. Thus, the majority of the increase of coverage for BALSA on PDB90D-B beyond that shown for PDB40D-B is due to the detection of structural neighbors that belong to the immunoglobulins superfamily.
Figure 6
Figure 6
The natural log of the BALSA score versus the associated EPQ given the four scoring matrix and gap penalty pairs, P(R(1), R(2)) under the true probability ratio of a homolog versus not, P(H) / P() = 6.8 / 1323, and the a priori assumption P(H) / P() = 1 / 1323. The probability of a non-homolog given the two sequences, P(R(1), R(2)), obtained from the Bayes factor under the true probability ratio is a good estimate of the EPQ independent of the parameters. P(R(1), R(2)) under the a priori assumption is a conservative estimate for the true EPQ and posterior probability obtained from the true prior odds ratio.
Figure 7
Figure 7
Tertiary structures of 1npx_2 and 3lada2, both multi-domain proteins consisting of multiple α helices and β sheets.
Figure 8
Figure 8
The structural alignment of NADH peroxidase, 1npx_2, and dihydrolipoamide dehydrogenase, 3lada2.
Figure 9
Figure 9
The structural alignment in (A) indicates that nearly all of the alignment between 1npx_2 and 3lada2 is conserved with two gaps. The SSEARCH optimal alignment (B) does not report the alignment of the first 34 residues of inpx_2 and 26 residues of 3lada2 and incorrectly reports the remaining gap. This first section missed is a loop and thus is also missed by the alignment distribution of BALSA (C). The alignment distribution clearly follows a similar pattern to that of the optimal but distinctly shows that there are many alignments similar to the optimal with comparative scores.

References

    1. Brenner S., Chothia,C. and Hubbard,T.J.P. (1998) Assessing sequence comparison methods with reliable structurally identified distant evolutionary relationships. Proc. Natl Acad. Sci. USA, 95, 6073–6078. - PMC - PubMed
    1. Pearson W.R. (1995) Comparison of methods for searching protein sequence databases. Protein Sci., 4, 1145–1160. - PMC - PubMed
    1. Smith T.F. and Waterman,M.S. (1981) Identification of common molecular subsequences. J. Mol. Biol., 147, 195–197. - PubMed
    1. Needleman S.B. and Wunsch,C.D. (1970) a general method applicable to the search for similarities in the amino acid sequence of two proteins. J. Mol. Biol., 48, 443–453. - PubMed
    1. Bucher P. and Hofmann,K. (1996) A sequence similarity search algorithm based on a probabilistic interpretation of an alignment scoring system. Proc. Int. Conf. Intell. Syst. Mol. Biol., 44, 44–51. - PubMed

Publication types