. 2002 Mar 1;30(5):e20.
doi: 10.1093/nar/30.5.e20.

A novel medium throughput quantitative competitive PCR technology to simultaneously measure mRNA levels from multiple genes

Affiliations

A novel medium throughput quantitative competitive PCR technology to simultaneously measure mRNA levels from multiple genes

Junlong Zhang et al. Nucleic Acids Res. .

Abstract

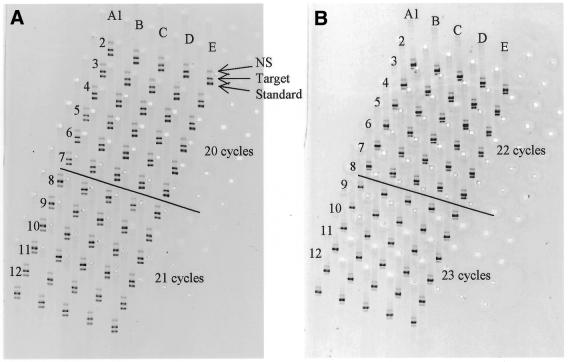
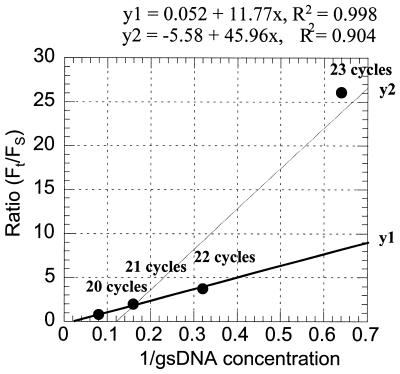
There is a great demand for technologies to simultaneously measure mRNA levels from multiple genes. Here we report a new quantitative competitive PCR technology and demonstrate simultaneous quantification of mRNA from multiple genes. First, a sequential 2-fold dilution series containing equal amounts of gene-specific standard DNAs for 10-12 genes is prepared. Second, the serially diluted standard DNAs are individually added to equal amounts of tissue-derived cDNA and amplified with gene-specific primers for 19-26 PCR cycles. Each gene/standard DNA pair is amplified individually. All amplified DNA products (n = 80) are resolved by one microplate array diagonal gel electrophoresis using 5% polyacrylamide. Changes in mRNA levels of approximately 15% can be detected by this technology. The mRNA levels from 10-12 genes were simultaneously quantified. mRNA levels were compared in RNA samples from rat liver, kidney and skeletal muscle. This quick, specific, sensitive, reproducible and yet inexpensive technique is ideal for simultaneously studying co-ordinate changes in mRNA levels from multiple genes.


Figures

Figure 1
Figure 1
Gel analysis of PCR products. Eighty samples were analysed in one MADGE containing 5% acrylamide. The sample loading wells (maximum 96) were indicated by crosses between eight columns (A–H) and 12 rows (1–12). The dotted arrow at A1 indicates the direction of electrophoresis of the samples. Each row represents one gene analysed (as indicated), while each column represents DNA amplified by the same number of PCR cycles. For example, samples in column A were amplified by 19 cycles, samples in column B by 20 cycles, and so on. The two samples loaded in wells E11 and F11 were used to measure the inter-assay CV for the gel. ANG, angiotensinogen; α-Fg, α-fibrinogen; β-Fg, β-fibrinogen; GK, glucokinase; GR, glucocorticoid receptor; HL, hepatic lipase; HSD1, 11β-hydroxysteroid dehydrogenase type 1; IR, insulin receptor; PEPCK, phosphoenolpyruvate carboxykinase; PPAR-α, peroxisome proliferator activated receptor-α.
Figure 2
Figure 2
Detection sensitivity of MT qcPCR. cDNA reverse transcribed from rat feotal liver total RNA was co-amplified with gsDNA by 20–23 cycles with primers for β-fibrinogen. For reactions amplified by 20 PCR cycles (A1–E6, A), equal amounts of gsDNA (1.25 pM final concentration) were added to each of these reactions. The amounts of cDNA added decreased by 10%, i.e. reactions in column B contained 90% of column A, reactions in column C contained 90% of column B, and so on. Six repeat PCRs were undertaken (A1–A6, B1–B6, etc.) to assess the intra-assay CV for MT qcPCR. In the same way, PCRs were set up and amplified by 21 cycles (in A7–E12, A), 22 cycles (A1–E6, B) and 23 cycles (A7–E12, B), with decreasing concentrations of gsDNA according to the number of PCR cycles amplified (0.63, 0.315 and 0.158 pM final concentrations for 21, 22 and 23 cycles, respectively). A non-specific band was observed for β-fibrinogen, which was specific to this sample, since this non-specific band was not observed in other samples (see for example Fig. 1). The non-specific band was most likely derived from amplification of contaminating genomic DNA.
Figure 3
Figure 3
Detection sensitivity of MT qcPCR for mRNA of low abundance. Parallel dilutions of both cDNA reverse transcribed from foetal liver total RNA and gsDNA were co-amplified using primers for β-fibrinogen by 30–33 PCR cycles. The PCR reaction conditions were identical for all reactions. The final concentrations for gsDNA were 1.95, 1.084, 0.601 and 0.334 fM for reactions amplified by 30, 31, 32 and 33 PCR cycles, respectively. For reactions amplified by each different PCR cycle number (e.g. 30 cycles), the amounts of cDNA added decreased from column A to D (or E to H) by 15%, i.e. the concentrations for cDNA in column B, C and D were 85, 70 and 55% of that in column A. For each specific cDNA concentration (e.g. concentration A), six repeats of an identical concentration of cDNA were added to PCR reactions (A1–A6) to assess the intra-assay CV for MT qcPCR. PCR cycle numbers are 30 (A1–D6), 31 (E1–H6), 32 (A7–D12) and 33 (E7–H12).
Figure 4
Figure 4
Dose–response curve for MT qcPCR. Values of Ft/Fs ratios (listed in Table 4) were plotted against the inverted concentrations of gsDNA according to equation 1. As Ft/Fs ratios were obtained by PCR amplification with different cycle numbers, the cycle numbers are included in the plot.
Figure 5
Figure 5
Simultaneous quantification of mRNA levels from multiple genes and multiple samples. Equal amounts of cDNA (containing ∼50 ng total RNA/reaction) reverse transcribed from total RNA from eight different rats (columns A–H) were amplified with gsDNA and PCR primers for 12 genes, by either 20 cycles (A), 21 cycles (B), 22 cycles (C) or 23 cycles (D). The PCR conditions were identical for all reactions and the amounts of gsDNA decreased by half from (A) to (D), as described in Materials and Methods. Reactions in each column (e.g. A1–A12) represent cDNA from one sample and each row represents one specific gene. The 12 gene-specific PCR primers were (from row 1 to row 12): acyl-CoA oxidase (ACO), CD36, diacylglycerol acyltransferase (DGAT), fatty acid synthase (FAS), 3-hydroxy-3-methylglutaryl-CoA reductase (HMG-CoA), lecithin-cholesterol acyltranserase (LCAT), long-chain acyl-CoA synthetase (LCAS), carnitine parmitoyl transferase I (CPT), hepatic lipase (HL), peroxisome proliferator-activated receptor-α (PPAR-α), peroxisome proliferator-activated receptor-γ (PPAR-γ) and insulin receptor (IR). Calculated mRNA copy numbers for the 12 genes are listed in Table 6.
None
Scheme 1.

Similar articles

Cited by

References

    1. Guillausseau P.J., Tielmans,D., Virally-Monod,M. and Assayag,M. (1997) Diabetes: from phenotypes to genotypes. Diabetes Metab., 23 (suppl. 2), 14–21. - PubMed
    1. Shimkets R.A. and Lifton,R.P. (1996) Recent advances in the molecular genetics of hypertension. Curr. Opin. Nephrol. Hypertens., 5, 162–165. - PubMed
    1. Drews J. (2000) Drug discovery: a historical perspective. Science, 287, 1960–1964. - PubMed
    1. Schena M., Shalon,D., Davis,R.W. and Brown,P.O. (1995) Quantitative monitoring of gene expression patterns with a complementary DNA microarray. Science, 270, 467–470. - PubMed
    1. Gibson U.E., Heid,C.A. and Williams,P.M. (1996) A novel method for real time quantitative RT-PCR. Genome Res., 6, 995–1001. - PubMed

Publication types