. 2002 Mar 1;30(5):e21.
doi: 10.1093/nar/30.5.e21.

Tumour class prediction and discovery by microarray-based DNA methylation analysis

Affiliations

Tumour class prediction and discovery by microarray-based DNA methylation analysis

Péter Adorján et al. Nucleic Acids Res. .

Abstract

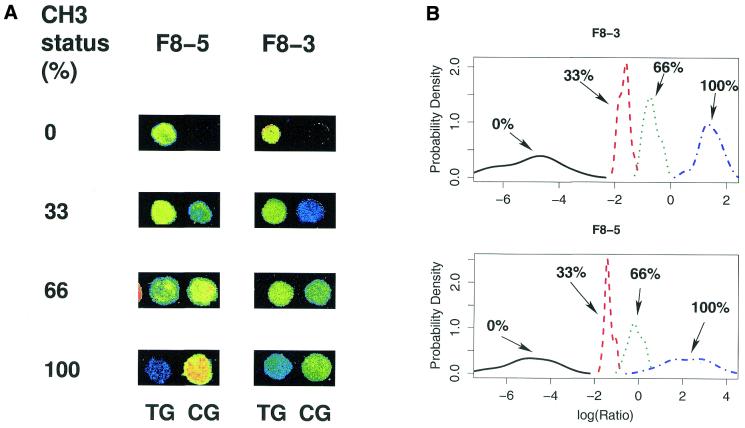
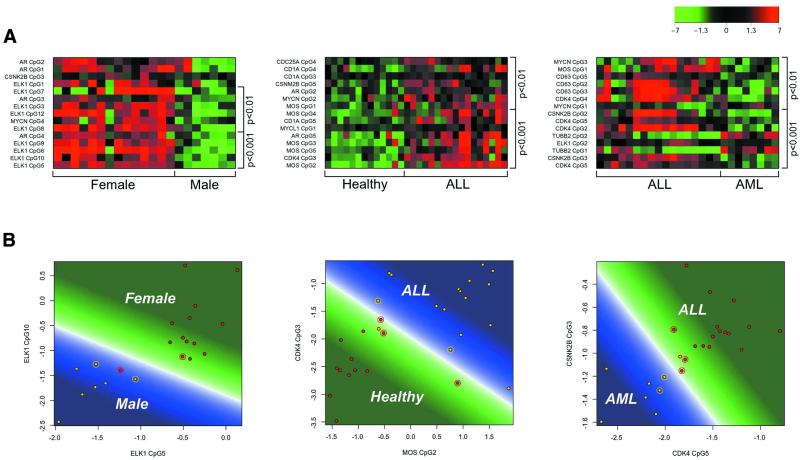
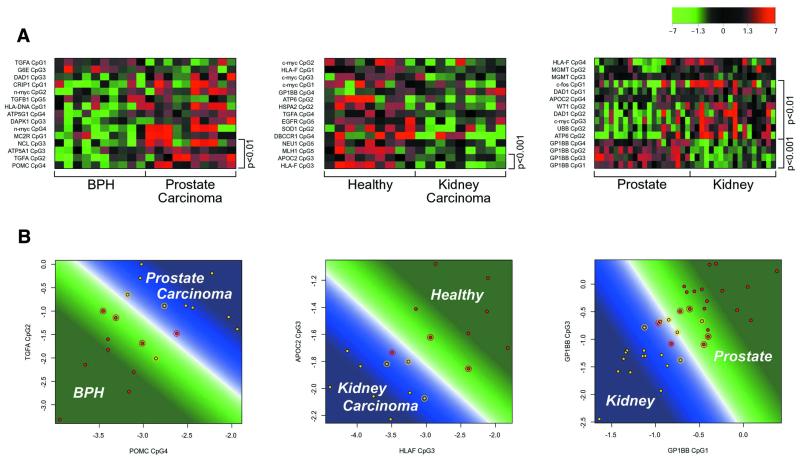
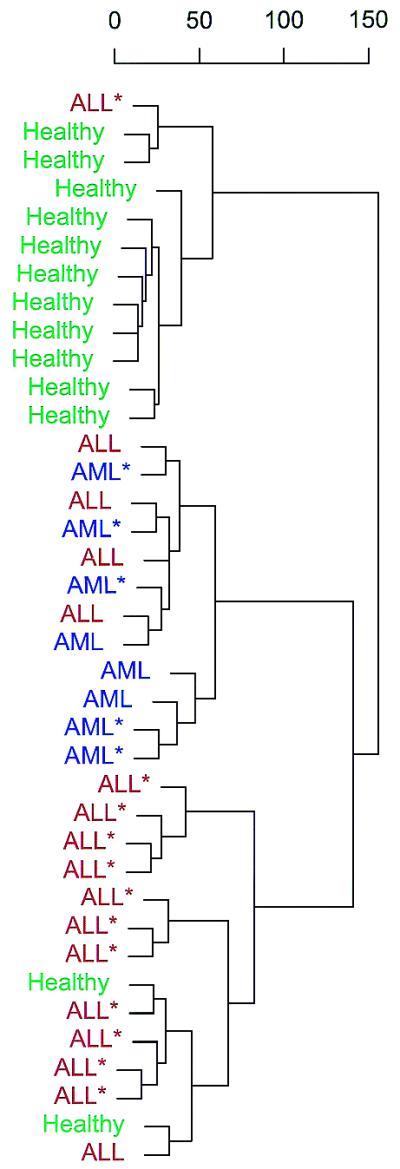
Aberrant DNA methylation of CpG sites is among the earliest and most frequent alterations in cancer. Several studies suggest that aberrant methylation occurs in a tumour type-specific manner. However, large-scale analysis of candidate genes has so far been hampered by the lack of high throughput assays for methylation detection. We have developed the first microarray-based technique which allows genome-wide assessment of selected CpG dinucleotides as well as quantification of methylation at each site. Several hundred CpG sites were screened in 76 samples from four different human tumour types and corresponding healthy controls. Discriminative CpG dinucleotides were identified for different tissue type distinctions and used to predict the tumour class of as yet unknown samples with high accuracy using machine learning techniques. Some CpG dinucleotides correlate with progression to malignancy, whereas others are methylated in a tissue-specific manner independent of malignancy. Our results demonstrate that genome-wide analysis of methylation patterns combined with supervised and unsupervised machine learning techniques constitute a powerful novel tool to classify human cancers.


Figures

Figure 1
Figure 1
Methylation analysis and quantification of two CpG dinucleotides in exon 14 of the human Factor VIII gene. For calibration purposes a series of hybridisations was performed with mixtures of artificially up- and down-methylated DNA fragments of the Factor VIII exon 14 gene. Down- and up-methylated DNA fragments were mixed in the ratios 0:3, 1:2, 2:1 and 3:0, representing methylation statuses of 100, 66, 33 and 0%, respectively. (A) Methylation detection by oligonucleotide microarray hybridisation. The fluorescence signals of the CG and TG versions of the Factor VIII exon 14 oligonucleotides F8-5 (TTATTAACGGGAAATAAT and TTATTAATGGGAAATAAT) and F8-3 (AATAAGTTCGAAATAGAA and AATAAGTTTGAAATAGAA) are shown, which were generated by samples reflecting methylation statuses of 0, 33, 66 and 100%. The hybridisation signals are shown as a false colour image with the colours blue, green and yellow indicating fluorescence signal ranges at 635 nm of 200–800, 800–2000 and 2000–8000, respectively. (B) Quantification of methylation measurements. For each CpG position two kinds of detection oligomers were used. Oligomers that hybridise if the CpG was methylated are referred to as CG oligomers and oligomers that hybridise if the CpG was unmethylated are referred to as TG oligos. For the four kinds of compounds 59, 36, 40 and 63 identical slides were made. The log ratio of the CG and TG oligomer hybridisation intensities was calculated and then averaged for experimental sub-groups each containing three identical experiments. The density function of the CG:TG ratios shows that measured values for the different mixtures are well separated and therefore allow high resolution detection of the methylation level of a single CpG. This is an essential prerequisite for methylation-dependent class prediction or class discovery. Taking into account only the 100 and 0% methylated DNA and averaging for the 22 CpG sites investigated in the calibration experiments, the average error for methylation detection is 4%. The log ratios are not grouped symmetrically around zero but are shifted towards negative values. We assume that the energetically different effects of G-T and A-C mismatches allow hybridisation of the methylated allele to the oligonucleotide representing the unmethylated more easily than vice versa.
Figure 2
Figure 2
(A) Methylation patterns of leukaemia samples and controls as described by the log ratio of the CG and TG signal intensities. The colour represents the distance from the mean between the two investigated groups (calculated as the mean of the group means). Hypermethylation corresponds to red, mean methylation level to black and hypomethylation to green. The labels on the left of the plot are gene and CpG identifiers. The labels on the right give the significance of the difference between the means of the two groups. Each row corresponds to a single CpG and each column to the methylation levels of one sample. The 15 CpG sites with the most significant differences between the two classes are shown. Classifications shown are male/female, healthy/ALL and AML/ALL. For male/female separation only non cell lines were used. As expected, the majority of significant CpG dinucleotides come from the two X chromosome genes (ELK1 and AR). (B) Class prediction of leukaemia samples and healthy controls. The plots show a SVM trained on the two most significant CpG sites for the respective discrimination using all available samples as training data. Circled points are the support vectors defining the borderline (white) between the area of the first (green) and the area of prediction of the second class (blue). The colour intensity corresponds to the prediction strength. Classifications shown are male/female, healthy/ALL and AML/ALL.
Figure 3
Figure 3
(A) Methylation patterns of solid tissues as described by the log ratio of the CG and TG signal intensities. The colour represents the distance from the mean between the two investigated groups (calculated as the mean of the group means). Hypermethylation corresponds to red, mean methylation level to black and hypomethylation to green. The labels on the left of the plot are gene and CpG identifiers. The labels on the right give the significance of the difference between the means of the two groups. Each row corresponds to a single CpG and each column to the methylation levels of one sample. The 15 CpG sites with the most significant differences between the two classes are shown. Classifications shown are BPH/prostate carcinoma, healthy kidney/kidney carcinoma, BPH and prostate carcinoma/healthy kidney and kidney carcinoma. (B) Class prediction of solid tissues. The plots show a SVM trained on the two most significant CpG sites for the respective discrimination using all available samples as training data. Circled points are the support vectors defining the borderline (white) between the area of the first (green) and the area of prediction of the second class (blue). The colour intensity corresponds to the prediction strength. Classifications shown are BPH/prostate carcinoma, healthy kidney/kidney carcinoma, BPH and prostate carcinoma/healthy kidney and kidney carcinoma.
Figure 4
Figure 4
Class discovery. The figure shows a hierarchical clustering of all available samples. Healthy individuals are coloured green, patients with ALL red and patients with AML blue. Asterisks indicate cell line samples. The feature space consisted of all CpG sites except those from the two X chromosome genes. The diagnosis was unknown to the algorithm.

References

    1. Jones P.A. (1996) DNA methylation errors and cancer. Cancer Res., 65, 2463–2467. - PubMed
    1. Chan M.F., Liang,G. and Jones,P.A. (2000) Relationship between transcription and DNA methylation. Curr. Top. Microbiol. Immunol., 249, 75–86. - PubMed
    1. Christman J.K., Sheikhnejad,G., Dizik,M., Abileah,S. and Wainfan,E. (1993) Reversibility of changes in nucleic acid methylation and gene expression induced in rat liver by severe dietary methyl deficiency. Carcinogenesis, 14, 551–557. - PubMed
    1. Pogribny I.P., Miller,B.J. and James,S.J. (1997) Alterations in hepatic p53 gene methylation patterns during tumor progression with folate/methyl deficiency in the rat. Cancer Lett., 115, 31–38. - PubMed
    1. Hanada M., Delia,D., Aiello,A., Stadtmauer,E. and Reed,J.C. (1993) bcl-2 gene hypomethylation and high-level expression in B-cell chronic lymphocytic leukemia. Blood, 82, 1820–1828. - PubMed