. 2002 Mar 1;21(5):920-9.
doi: 10.1093/emboj/21.5.920.

The Ppz protein phosphatases are key regulators of K+ and pH homeostasis: implications for salt tolerance, cell wall integrity and cell cycle progression

Affiliations

The Ppz protein phosphatases are key regulators of K+ and pH homeostasis: implications for salt tolerance, cell wall integrity and cell cycle progression

Lynne Yenush et al. EMBO J. .

Abstract

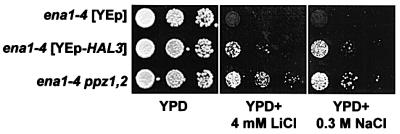
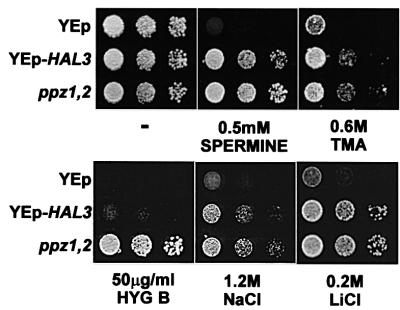
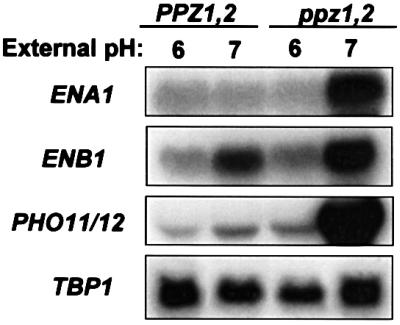
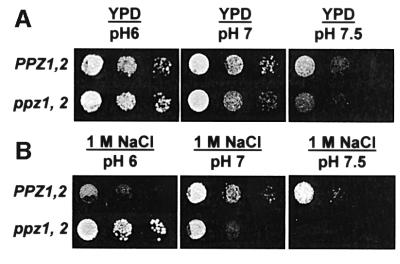
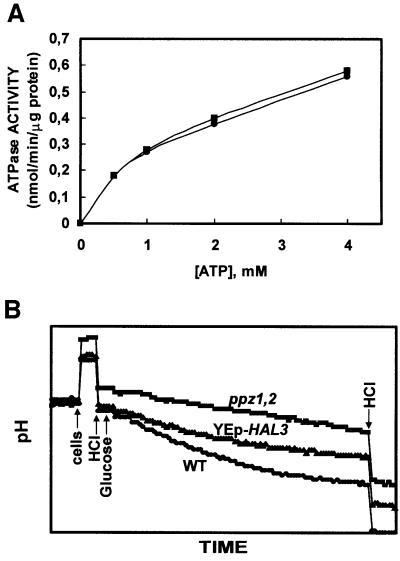
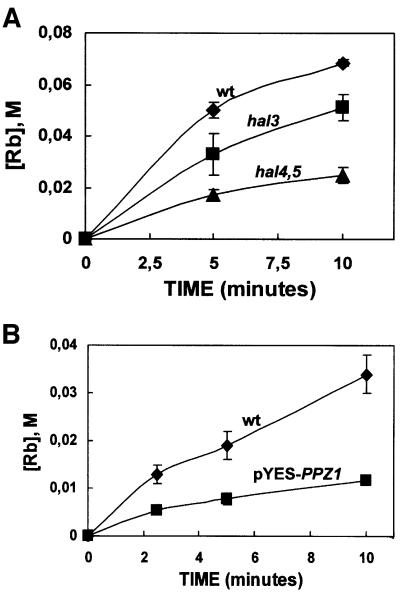
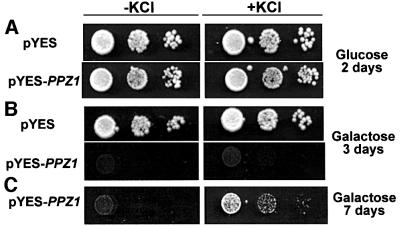
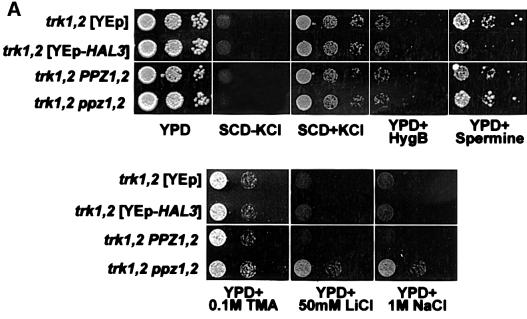
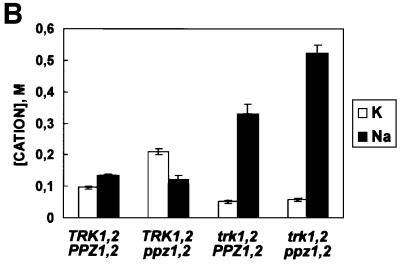
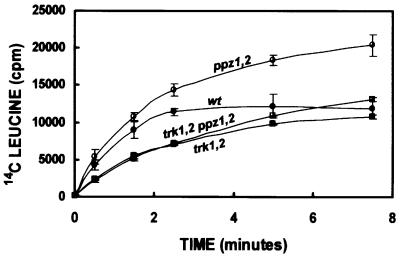
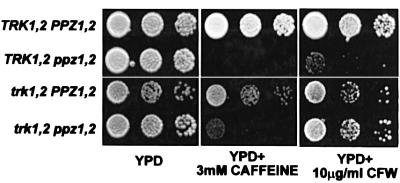
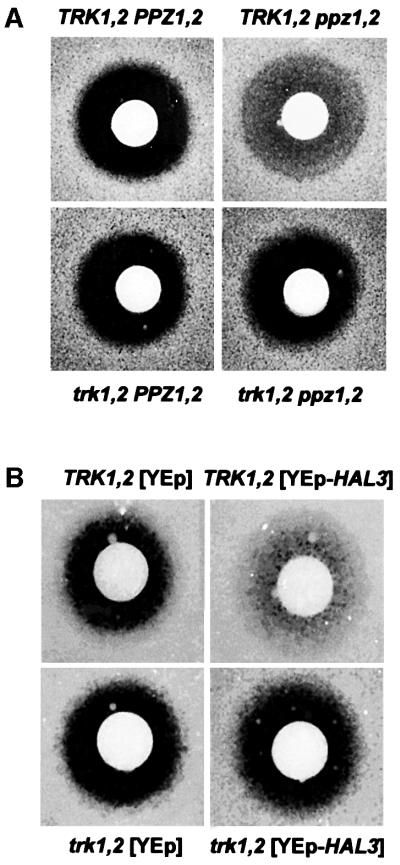
The yeast Ppz protein phosphatases and the Hal3p inhibitory subunit are important determinants of salt tolerance, cell wall integrity and cell cycle progression. We present several lines of evidence showing that these disparate phenotypes are connected by the fact that Ppz regulates K+ transport. First, salt tolerance, cell wall integrity and cell cycle phenotypes of Ppz mutants are dependent on the Trk K+ transporters. Secondly, Ppz mutants exhibit altered activity of the Trk system, as measured by rubidium uptake. Thirdly, Ppz mutants exhibit altered intracellular K+ and pH, as expected from H+ efflux providing electrical balance during K+ uptake. Our unifying picture of Ppz phenotypes contends that activation of Trk by decreased Ppz activity results in plasma membrane depolarization (reducing uptake of toxic cations), increased intracellular K+ and turgor (compromising cell integrity), and increased intracellular pH (augmenting the expression of pH-regulated genes and facilitating alpha-factor recovery). In addition to providing a coherent explanation for all Ppz-dependent phenotypes, our results provide evidence for a causal relationship between intracellular cation homeostasis and a potential cell cycle checkpoint.


Figures

None
Fig. 1. ENA-independent salt tolerance phenotypes of YEp-HAL3 and ppz1,2 strains. DBY746 ena1-4::HIS3[pRS699], DBY746 ena1-4::HIS3[pRS699-HAL3] and DBY746 ena1-4::HIS3 ppz1::URA3 ppz2::TRP1 strains were grown to saturation in selective media, serially diluted in sterile water and spotted on to YPD plates containing the indicated amount of salt. Images were taken after 2–3 days of incubation at 28°C. Identical results were obtained from at least three independent colonies in two separate experiments.
None
Fig. 2. YEp-HAL3 and ppz1,2 strains are tolerant to toxic cations. W303-1A [pYPGE15], W303-1A [pYPGE15-HAL3], W303-1A and W303-1A ppz1::URA3 ppz2::TRP1 strains were grown to saturation in selective media, serially diluted in sterile water and spotted on to YPD plates containing the indicated amount of cations. Images were taken after 2–3 days of incubation at 28°C. Identical results were obtained from at least three independent colonies in three separate experiments, using various concentrations of each cation and in two different genetic backgrounds (DBY746 and W303-1A).
None
Fig. 3. Northern blot analysis of the steady-state levels of alkaline-induced transcripts. Wild-type (DBY746) and ppz1,2 (DBY746 ppz1::URA3 ppz2::TRP1) strains were grown in YPD buffered to either pH 6 or 7 with 50 mM Bis-Tris. After extraction, RNA was separated by electrophoresis and transferred to nitrocellulose. Membranes were then analysed with the radiolabelled probes indicated. TBP1 was used as an internal loading control. Identical results were obtained in two separate experiments.
None
Fig. 4. Growth and sodium tolerance in ppz1,2 strains is pH dependent. Wild-type (DBY746) and ppz1,2 (DBY746 ppz1::URA3 ppz2::TRP1) strains were grown to saturation in selective media, serially diluted in sterile water and spotted on to YPD plates buffered to the indicated pH, without (A) or with (B) 1 M NaCl. Images were taken after 2–3 days (pH 6.5 and 7) or 5 days (pH 7.5) of incubation at 28°C. Identical results were obtained in two separate experiments.
None
Fig. 5. Analysis of Pma1p activity in vitro and in vivo. (A) ATPase activity of plasma membranes purifed from glucose-fed cells was assayed at pH 6.5. DBY746 (squares), and DBY746 ppz1::URA3 ppz2::TRP1 (circles). Each reaction contained 2 µg of protein and the samples were incubated at 28°C for 60 min. Each data point represents the average of two independently isolated membrane preparations each assayed in duplicate. Standard deviations were <5%. (B) The strains indicated (DBY746 [pRS699], DBY746 [pRS699-HAL3] and DBY746 ppz1::URA3 ppz2::TRP1) were grown to mid-log phase, harvested, washed and resuspended in sterile water and incubated for 3 h at 28°C. Cells (30 mg) were then suspended in 10 ml of assay buffer and pH changes were recorded after the addition of 200 µmol of glucose. Cells, glucose and HCl (400 nmol for calibration) were added where indicated. Similar results were observed in two separate experiments and after overnight starvation at 4°C.
None
Fig. 6. Rb+ uptake is modulated by the gene dosage of both HAL3 and PPZ1. (A) The strains indicated, W303-1A (diamonds); W303-1A hal3::LEU2 (squares); W303-1A hal4::LEU2, hal5::HIS3 (triangles), were grown to exponential phase in selective media, washed and incubated in the potassium starvation medium for 4 h. After further washing, the uptake of 0.2 mM Rb was determined by HPLC analysis as described in Materials and methods. (B) The experiment was performed as described in (A), except that PPZ1 expression was induced by incubation in galactose medium before the potassium starvation procedure. W303-1A [pYES2] (diamonds); W303-1A [pYES2-PPZ1] (squares). Data are the average of triplicate determinations and the error bars represent the standard deviation for each point.
None
Fig. 7. Addition of exogenous KCl partially rescues the slow-growth phenotype of a PPZ1-overexpressing strain. The strains indicated (W303-1A [pYES2] and W303-1A [pYES2-PPZ1]) were grown to saturation in selective media and then serially diluted and spotted on to plates with or without the addition of 0.1 M KCl, and using glucose (A) or galactose (B and C) as the carbon source (to induce PPZ1 expression). Images of the plates in (A) were taken after 2 days. (B) and (C) depict the same plates imaged after 3 or 7 days, respectively. Similar results were observed in two separate experiments and with addition of 0.1 or 0.05 M KCl.
None
Fig. 8. Characterization of the tolerance to toxic cations mediated by YEp-HAL3 and ppz1,2 in the trk1,2 background. (A) The strains indicated (W303-1A trk1::LEU2 trk2::HIS3 [YPGE15], W303-1A trk1::LEU2 trk2::HIS3 [YPGE15-HAL3] and W303-1A trk1::LEU2 trk2::HIS3 ppz1::URA3 ppz2::TRP1) were grown to saturation in selective media supplemented with 0.2 M KCl, serially diluted in sterile water and spotted on to YPD plates containing the indicated amount of cations. Images were taken after 2–3 days (top panel) or 6 days (lower panel) of incubation at 28°C. Identical results were obtained from at least three independent colonies in three separate experiments. (B) The strains indicated were grown to OD660 = 0.5 in YPD media containing 0.8 M NaCl. Cells were washed extensively with 1.2 M sorbitol, 10 mM MgCl2, lysed by boiling and after centrifugation to remove cellular debris, internal ion concentrations were determined by HPLC analysis, as described. Similar results were observed in two separate experiments.
None
Fig. 9. ppz1,2-mediated changes in leucine uptake depends on the presence of TRK1,2. Determination of [14C]leucine uptake was performed as described (Pascual-Ahuir et al., 2001). Data are the average of three separate experiments and error bars represent the standard deviation for each point. W303-1A (filled circles); W303-1A ppz1::URA3, ppz2::TRP1 (open circles); W303-1A trk1::LEU2 trk2::HIS3 (filled squares); W303-1A trk1::LEU2 trk2::HIS3 ppz1::URA3 ppz2::TRP1 (open squares).
None
Fig. 10. Sensitivity of the ppz1,2 strain to both caffeine and calcofluor white is relieved by further disruption of TRK1,2. The strains indicated: W303-1A; W303-1A ppz1::URA3 ppz2::TRP1; W303-1A trk1::LEU2 trk2::HIS3; and W303-1A trk1::LEU2 trk2::HIS3 ppz1::URA3 ppz2::TRP1, were grown to saturation in selective media, serially diluted in sterile water and spotted on to YPD plates containing the indicated amount of caffeine (A) or calcofluor white (B). Images were taken after 2–3 days of incubation at 28°C. Identical results were observed in at least two separate experiments.
None
Fig. 11. YEp-HAL3- and ppz1,2-mediated α-factor recovery depends on the presence of TRK1,2. The strains (A) W303-1A; W303-1A ppz1::URA3 ppz2::TRP1; W303-1A trk1::LEU2 trk2::HIS3; W303-1A trk1::LEU2 trk2::HIS3 ppz1::URA3 ppz2::TRP1 and (B) W303-1A [YPGE15]; W303-1A [YPGE15-HAL3]; W303-1A trk1::LEU2 trk2::HIS3 [YPGE15]; W303-1A trk1::LEU2 trk2::HIS3 [YPGE15-HAL3] were grown to an OD of 0.4 in complete media and the assay was performed as described in Materials and methods. Images of the plates were taken after 48 h and similar results were observed in four separate experiments.

References

    1. Albert A., Yenush,L., Gil-Mascarell,M.R., Rodriguez,P.L., Patel,S., Martinez-Ripoll,M., Blundell,T.L. and Serrano,R. (2000) X-ray structure of yeast Hal2p, a major target of lithium and sodium toxicity and identification of framework interactions determining cation sensitivity. J. Mol. Biol., 295, 927–938. - PubMed
    1. Arndt K.T., Styles,C.A. and Fink,G.R. (1989) A suppressor of a HIS4 transcriptional defect encodes a protein with homology to the catalytic subunit of protein phosphatases. Cell, 56, 527–537. - PubMed
    1. Brunelli J.P. and Pall,M.L. (1993) A series of yeast/Escherichia coli λ expression vectors designed for directional cloning of cDNAs and cre/lox-mediated plasmid excision. Yeast, 9, 1309–1318. - PubMed
    1. Clotet J., Posas,F., de Nadal,E. and Arino,J. (1996) The NH2-terminal extension of protein phosphatase PPZ1 has an essential functional role. J. Biol. Chem., 271, 26349–26355. - PubMed
    1. Clotet J., Gari,E., Aldea,M. and Arino,J. (1999) The yeast ser/thr phosphatases sit4 and ppz1 play opposite roles in regulation of the cell cycle. Mol. Cell. Biol., 19, 2408–2415. - PMC - PubMed

Publication types

MeSH terms

Substances