

doi: 10.1093/emboj/21.5.1101.
Hyperacetylation of chromatin at the ADH2 promoter allows Adr1 to bind in repressed conditions
Affiliations
- PMID: 11867538
- PMCID: PMC125900
- DOI: 10.1093/emboj/21.5.1101
Item in Clipboard
Hyperacetylation of chromatin at the ADH2 promoter allows Adr1 to bind in repressed conditions
EMBO J.
.
Abstract
We report that in vivo increased acetylation of the repressed Saccharomyces cerevisiae ADH2 promoter chromatin, as obtained by disrupting the genes for the two deacetylases HDA1 and RPD3, destabilizes the structure of the TATA box-containing nucleosome. This acetylation-dependent chromatin remodeling is not sufficient to allow the binding of the TATA box-binding protein, but facilitates the recruitment of the transcriptional activator Adr1 and induces faster kinetics of mRNA accumulation when the cells are shifted to derepressing conditions.
Figures
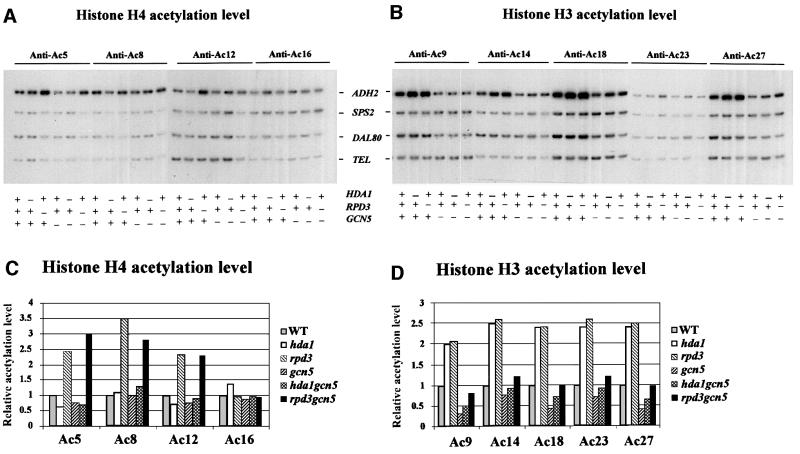
Fig. 1. Effects of histone acetyltransferase GCN5 and histone deacetylases HDA1 and RPD3 on acetylation of histones at the ADH2 promoter. ChIP demonstrating the effects of histone acetyltransferase and histone deacetylase disruptions on the acetylation of (A) histone H4 sites K5, K8, K12 and K16, and (B) histone H3 sites K9, K14, K18, K23 and K27. The ADH2 fragment spans the region from –223 to +114, relative to the ATG. Amplification of a 138 bp fragment 0.5 kb from the telomere (Tel) of chromosome VI-R was used as a reference to ensure equal loading of samples. Yeast strains used for ChIP were wild type (WT) (YDS2), hda1 (WJY111), rpd3 (WJY140), gcn5 (WJY139), hda1/gcn5 (WJY142) and rpd3/gcn5 (WJY143) (Vogelauer et al., 2000). SPS2 and DAL80 were found to be relatively unaffected by these mutations and were used as negative controls. (C and D) Quantification of the increase in H4, H3 acetylation in mutant cells relative to wild-type cells. [α-32P]dATP was added to the PCR mixture, and the PhosphorImager was used to quantitate the intensity of ADH2 PCR bands in these mutants relative to WT after normalizing to the TEL bands.
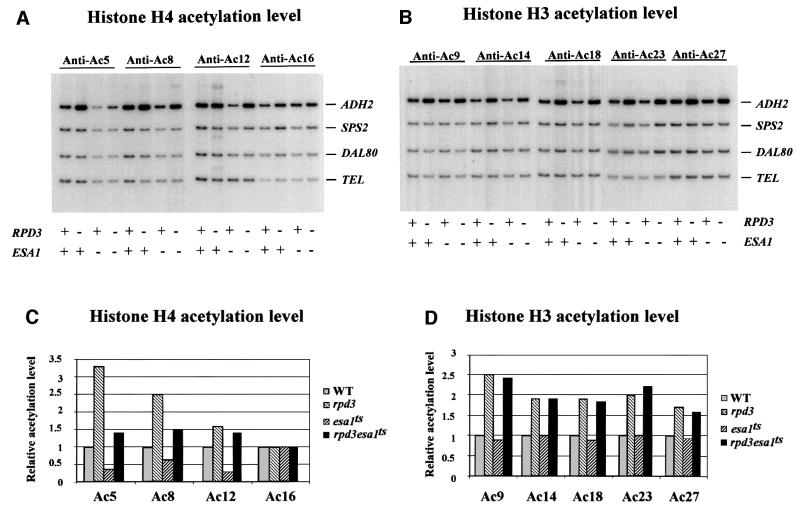
Fig. 2. Effects of histone acetyltransferase ESA1 on acetylation of histones at the ADH2 promoter. ChIP demonstrating the effects of histone acetyltranferase esa1ts mutant on the acetylation of (A) histone H4 sites K5, K8, K12 and K16, and (B) histone H3 sites K9, K14, K18, K23 and K27. The ADH2 fragment spans the region from –223 to +114, relative to the ATG. Amplification of a 138 bp fragment 0.5 kb from the telomere (Tel) of chromosome VI-R was used as a reference to ensure equal loading of samples. Yeast strains used for ChIP were WT (LPY3431), rpd3 (NSY164), esa1ts (LPY3430), rpd3/esa1ts (NSY165). SPS2 and DAL80 were found to be relatively unaffected by these mutations and were used as negative controls. (C and D) Quantification of the increase in H4, H3 acetylation in mutant cells relative to wild-type cells. [α-32P]dATP was added to the PCR mixture, and the PhosphorImager was used to quantitate the intensity of ADH2 PCR bands in these mutants relative to WT after normalizing to the TEL bands.
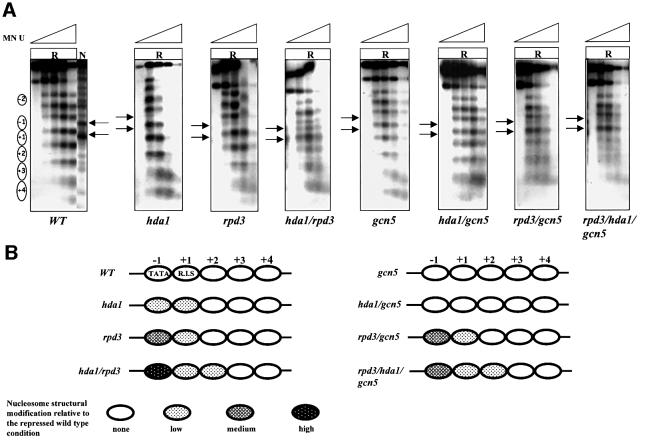
Fig. 3. Effects of histone acetylation on ADH2 chromatin structure. (A) MN analysis of the ADH2 promoter region in repressing conditions (R, 3% glucose). Nystatin-permeabilized spheroplasts were reacted with increasing amounts of MN (U = units/0.25 ml: 0, 0.57, 1.7, 5 and 15), deproteinized, digested with BamHI and HindIII (map positions are –1202 and +760, respectively), and analyzed by indirect end-labeling. Nucleosomes (i.e. protected areas) are represented as ovals. Lane N (naked control) contains deproteinized DNA from plasmid pFA treated in vitro with MN and the same restriction enzymes as the in vivo samples. (B) Summary of nucleosome structural modifications. The chromatin changes, relative to the wild-type YDS2 strain, are summarized; the different shadings indicate the intensity of the changes (none, low, medium and high).
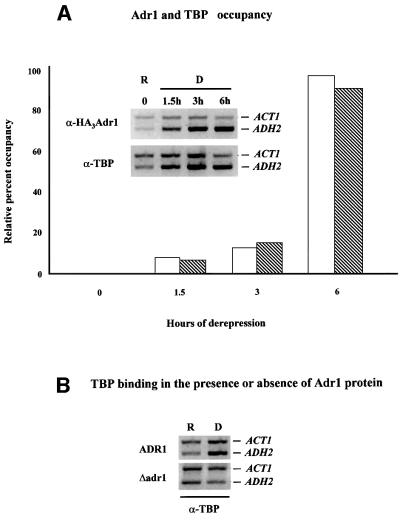
Fig. 4. Adr1 and TBP occupancy of the ADH2 promoter. (A) ChIP assays for Adr1-HA and TBP were performed with anti-HA and anti-yTBP, respectively, as described in Materials and methods. The primer pairs for the PCR analysis, followed by gel electrophoresis (inset), are located at –432 and –139 from the ADH2 ATG. The primer pairs for the ACT1 control were located at +418 and +797 in the ACT1 ORF. Real-time PCR analysis was carried out with an Applied Biosystems Model 700 and software as described by the manufacturer. The primer pairs for the real-time PCR analysis are located at –283 and –187 from the ADH2 ATG. The primer pairs for the ACT1 control were located at +448 and +531 in the ACT1 ORF. The real-time PCR data are shown in the graph and are plotted as a percent of the ADH2 product generated using ChIP DNA isolated from repressed cells, after correcting for the amount of ACT1 DNA in each sample (white and hatched bars refer to Adr1 and TBP occupancy, respectively). R, repressed conditions (3% glucose); D, derepressed conditions (0.05% glucose). (B) ChIP assays for TBP occupancy in wild-type and adr1 strains. PCR and electrophoretic analysis were carried out as described in Materials and methods and in (A).
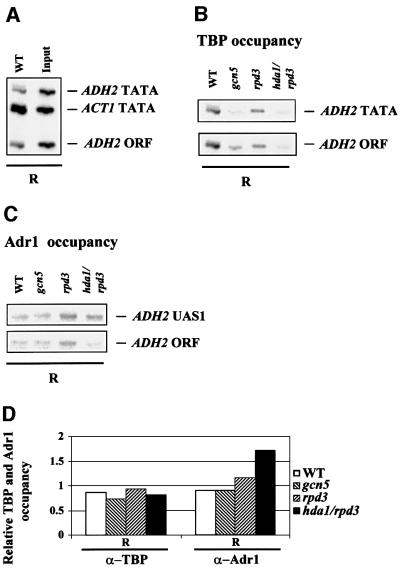
Fig. 5. Acetylation-dependent Adr1 binding of the repressed ADH2 promoter. (A) Positive control for TBP binding. DNA immuno precipitated with anti-yTBP (α-TBP) from wild-type extract under repressing conditions (R) and input DNA derived from the same extract were amplified with three different pairs of oligonucleotides at the same time: ADH2 TATA fragment (234 bp) spans the region from –223 to +11; ACT1 TATA fragment (182 bp) contains the ACT1 TATA box; ADH2 ORF fragment (108 bp) contains a small portion of the ADH2 coding region from +658 to +778 (negative control). Amplifications were performed using the following amounts of DNA: WT = 1/50; Input = 1/2500. (B) ChIP with anti-yTBP antibody illustrating the occupancy of the ADH2 TATA box region by TBP in the WT, gcn5, rpd3 and hda1/rpd3 strains, in repressing conditions (R). The TBP-immunoprecipitated material was amplified by PCR with two different pairs of oligonucleotides at the same time. (C) ChIP with anti-Adr1 antibody (α-Adr1) demonstrating the occupancy of the ADH2 promoter in the WT, gcn5, rpd3 and hda1/rpd3 strains in repressing conditions (R). The Adr1-immunoprecipitated material was amplified by PCR with two different pairs of oligonucleotides at the same time. The ADH2 UAS1 fragment (217 bp) spans the region from –379 to –162. (D) Densitometric evaluation of the results shown in (B) and (C). The histograms were obtained by dividing the values of the ADH2 TATA and of the ADH2 UAS1 fragments by the value of the ADH2 ORF fragment, used as a negative control.
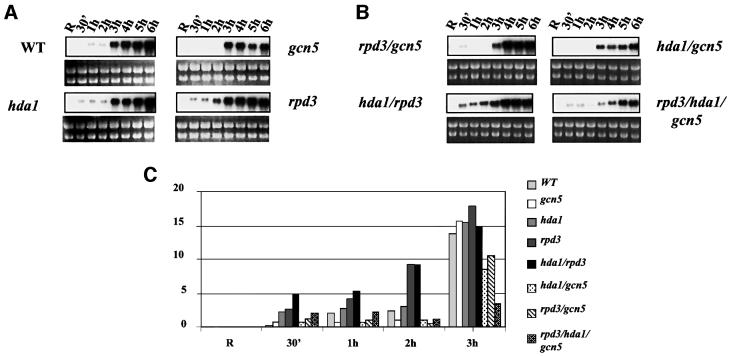
Fig. 6. Effects of histone acetylation on the kinetics of ADH2 mRNA accumulation. (A and B) Northern analysis for the wild-type YDS2 strain and the mutants indicated. Cells were grown overnight in repressing conditions (3% glucose, lanes R), washed, resuspended in fresh medium containing 0.05% glucose and analyzed at the times indicated. (C) Histogram representing the densitometric evaluation of the results shown in (A) and (B), from R (repressing condition) up to 3 h. (D) Northern analysis for the wild-type LPY3430 and its isogenic esa1ts. Cells were grown overnight at 28°C in repressing conditions (R1 lanes). The culture was split into two: one flask was kept at 28°C, the other was shifted to 37°C for 8 h in order to inactivate Esa1 (Clarke et al., 1999). The same amount of cells from each culture was analyzed (R2 = 28°C; R3 = 37°C). After Esa1 inactivation, the cells were washed and resuspended in fresh medium containing 0.05% glucose and analyzed at the times indicated (from 10 min to overnight). (E) Histogram representing the densitometric evaluation of the results shown in (D), from the initial repressing conditions (R = R1, R2, R3) up to 3 h.
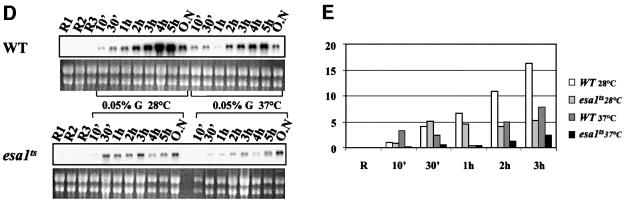
Fig. 6. Effects of histone acetylation on the kinetics of ADH2 mRNA accumulation. (A and B) Northern analysis for the wild-type YDS2 strain and the mutants indicated. Cells were grown overnight in repressing conditions (3% glucose, lanes R), washed, resuspended in fresh medium containing 0.05% glucose and analyzed at the times indicated. (C) Histogram representing the densitometric evaluation of the results shown in (A) and (B), from R (repressing condition) up to 3 h. (D) Northern analysis for the wild-type LPY3430 and its isogenic esa1ts. Cells were grown overnight at 28°C in repressing conditions (R1 lanes). The culture was split into two: one flask was kept at 28°C, the other was shifted to 37°C for 8 h in order to inactivate Esa1 (Clarke et al., 1999). The same amount of cells from each culture was analyzed (R2 = 28°C; R3 = 37°C). After Esa1 inactivation, the cells were washed and resuspended in fresh medium containing 0.05% glucose and analyzed at the times indicated (from 10 min to overnight). (E) Histogram representing the densitometric evaluation of the results shown in (D), from the initial repressing conditions (R = R1, R2, R3) up to 3 h.
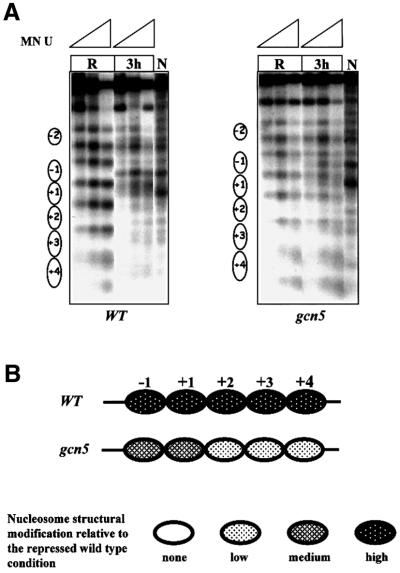
Fig. 7. Role of the acetyltransferase Gcn5 in ADH2 promoter chromatin remodeling. (A) MN analysis of the ADH2 promoter region in repressing conditions (R, 3% glucose) and at 3 h after the shift to derepressing conditions (3 h, 0.05% glucose). Nystatin-permeabilized spheroplasts, of both wild-type and gcn5 strains, were reacted with increasing amounts of MN (U = units/0.25 ml: 0.57, 1.7 and 5), deproteinized, digested with BamHI and HindIII (map positions are –1202 and +760, respectively), and analyzed by indirect end-labeling. Nucleosomes (i.e. protected areas) are represented as ovals. Lanes N (naked control) contain deproteinized DNA from plasmid pFA treated in vitro with MN and the same restriction enzymes as the in vivo samples. (B) Summary of nucleosome structural modifications. The chromatin changes in the gcn5 strain, relative to the wild-type YDS2 strain, are summarized; the different shadings indicate the intensity of the changes (none, low, medium and high).
Similar articles
-
Post-TATA binding protein recruitment clearance of Gcn5-dependent histone acetylation within promoter nucleosomes.Mol Cell Biol. 2003 Nov;23(21):7809-17. doi: 10.1128/MCB.23.21.7809-7817.2003. Mol Cell Biol. 2003. PMID: 14560024 Free PMC article.
-
A transient histone hyperacetylation signal marks nucleosomes for remodeling at the PHO8 promoter in vivo.Mol Cell. 2001 Mar;7(3):529-38. doi: 10.1016/s1097-2765(01)00200-3. Mol Cell. 2001. PMID: 11463378
-
Common chromatin architecture, common chromatin remodeling, and common transcription kinetics of Adr1-dependent genes in Saccharomyces cerevisiae.Biochemistry. 2004 Jul 13;43(27):8878-84. doi: 10.1021/bi049577+. Biochemistry. 2004. PMID: 15236596
-
A SAGA of histone acetylation and gene expression.Trends Genet. 1997 Nov;13(11):427-9. doi: 10.1016/s0168-9525(97)01292-4. Trends Genet. 1997. PMID: 9385836 Review. No abstract available.
-
Recruitment of chromatin remodelling factors during gene activation via the glucocorticoid receptor N-terminal domain.Biochem Soc Trans. 2000;28(4):410-4. Biochem Soc Trans. 2000. PMID: 10961930 Review.
Cited by
-
Combined global localization analysis and transcriptome data identify genes that are directly coregulated by Adr1 and Cat8.Mol Cell Biol. 2005 Mar;25(6):2138-46. doi: 10.1128/MCB.25.6.2138-2146.2005. Mol Cell Biol. 2005. PMID: 15743812 Free PMC article.
-
Repressive chromatin affects factor binding at yeast HO (homothallic switching) promoter.J Biol Chem. 2011 Oct 7;286(40):34809-19. doi: 10.1074/jbc.M111.281626. Epub 2011 Aug 12. J Biol Chem. 2011. PMID: 21840992 Free PMC article.
-
The Saccharomyces cerevisiae acetyltransferase Gcn5 exerts antagonistic pleiotropic effects on chronological ageing.Aging (Albany NY). 2023 Oct 23;15(20):10915-10937. doi: 10.18632/aging.205109. Epub 2023 Oct 23. Aging (Albany NY). 2023. PMID: 37874684 Free PMC article.
-
The transcriptional coactivators SAGA, SWI/SNF, and mediator make distinct contributions to activation of glucose-repressed genes.J Biol Chem. 2008 Nov 28;283(48):33101-9. doi: 10.1074/jbc.M805258200. Epub 2008 Sep 30. J Biol Chem. 2008. PMID: 18826948 Free PMC article.
-
Natural promoters and promoter engineering strategies for metabolic regulation in Saccharomyces cerevisiae.J Ind Microbiol Biotechnol. 2023 Feb 17;50(1):kuac029. doi: 10.1093/jimb/kuac029. J Ind Microbiol Biotechnol. 2023. PMID: 36633543 Free PMC article. Review.
References
-
- Aalfs J.D. and Kingston,R.E. (2000) What does ‘chromatin remodeling’ mean? Trends Biochem. Sci., 25, 548–555. - PubMed
-
- Anderson J.D., Lowary,P.T. and Widom,J. (2001) Effects of histone acetylation on the equilibrium accessibility of nucleosomal DNA target sites. J. Mol. Biol., 307, 977–985. - PubMed
-
- Beier D.R. and Young,E.T. (1982) Characterization of a regulatory region upstream of the ADR2 locus of S. cerevisiae. Nature, 300, 724–728. - PubMed
Publication types
MeSH terms
Substances
Grants and funding
LinkOut - more resources
Full Text Sources
Molecular Biology Databases
