. 2002 Mar 5;99(5):2660-5.
doi: 10.1073/pnas.052708599. Epub 2002 Feb 26.

Structural views of the ligand-binding cores of a metabotropic glutamate receptor complexed with an antagonist and both glutamate and Gd3+

Affiliations

Structural views of the ligand-binding cores of a metabotropic glutamate receptor complexed with an antagonist and both glutamate and Gd3+

Daisuke Tsuchiya et al. Proc Natl Acad Sci U S A. .

Abstract

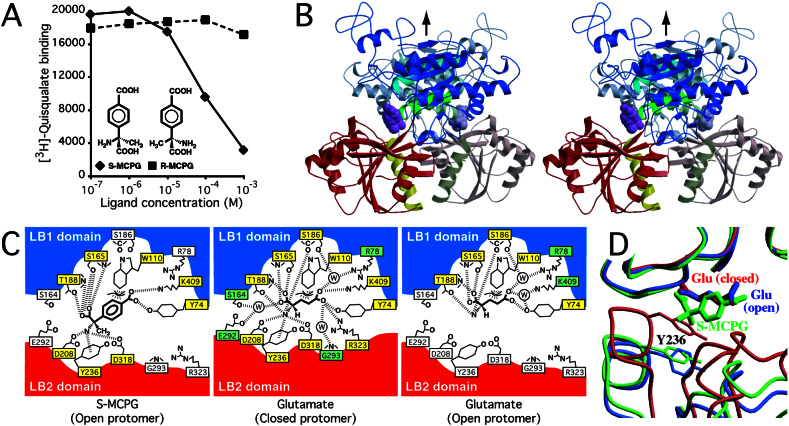
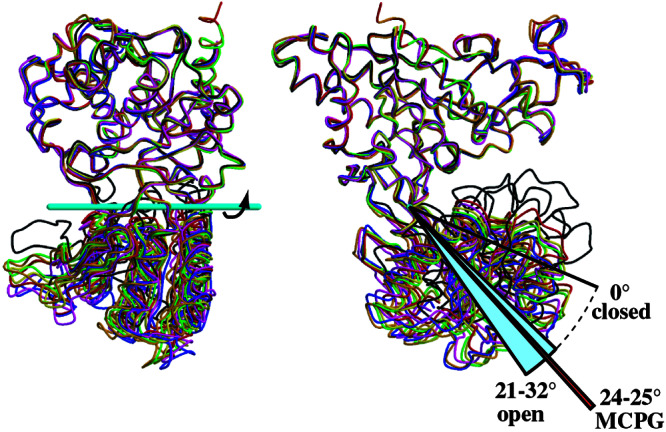
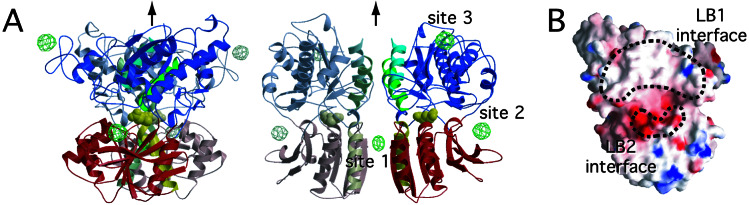
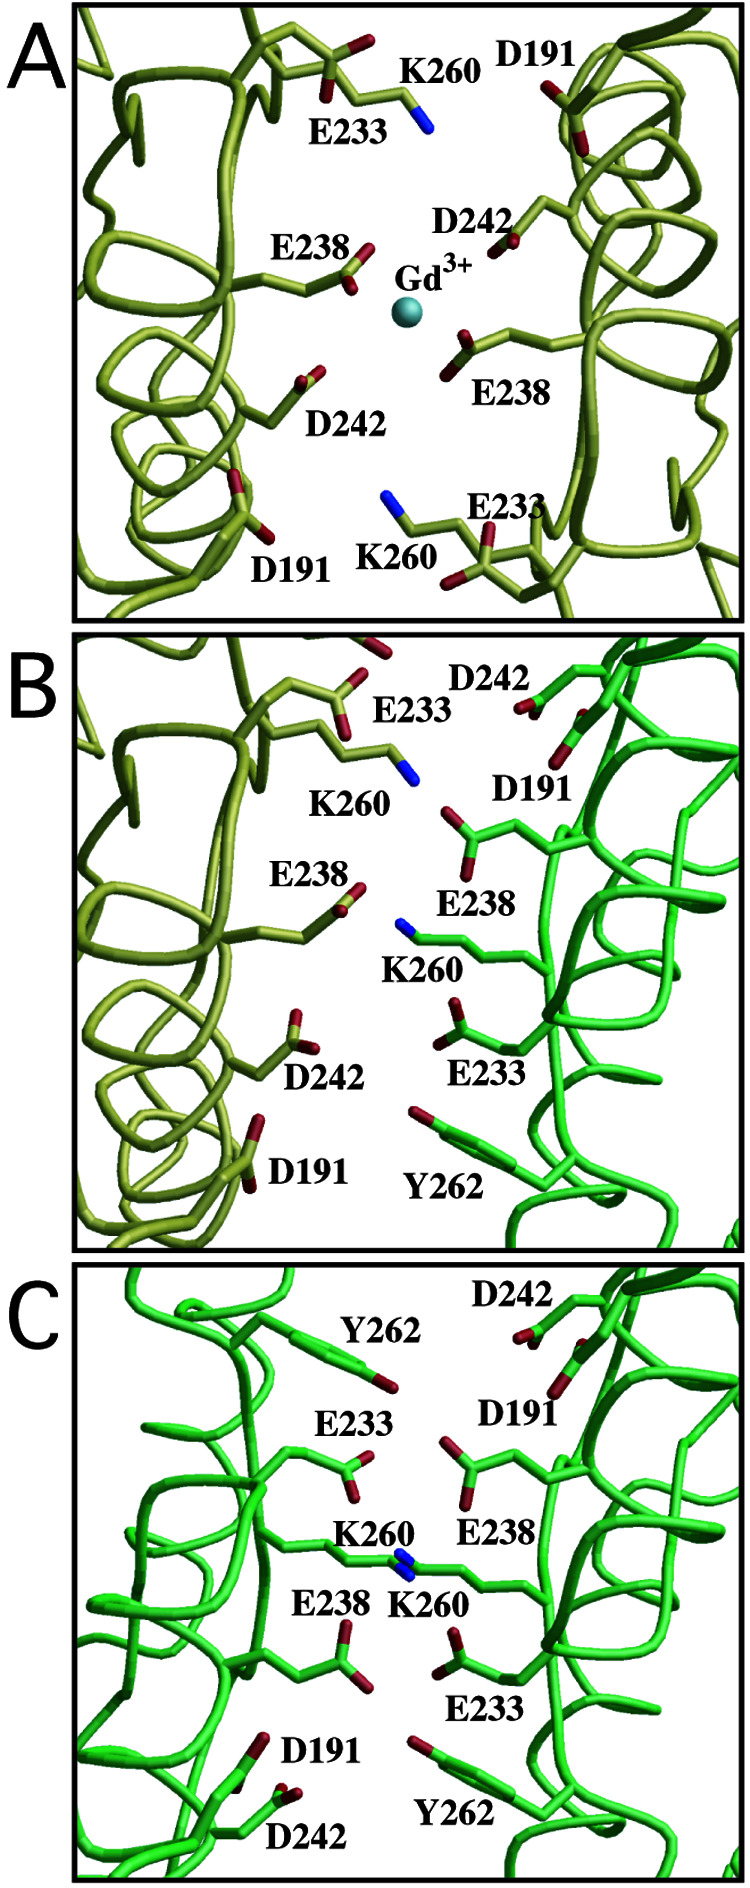
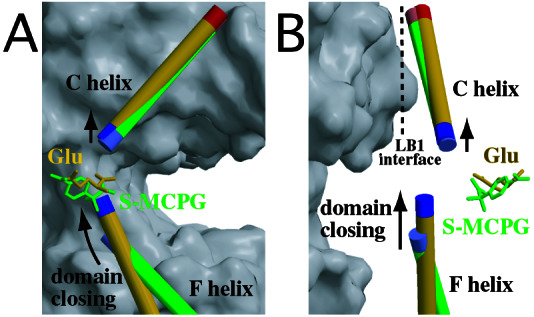
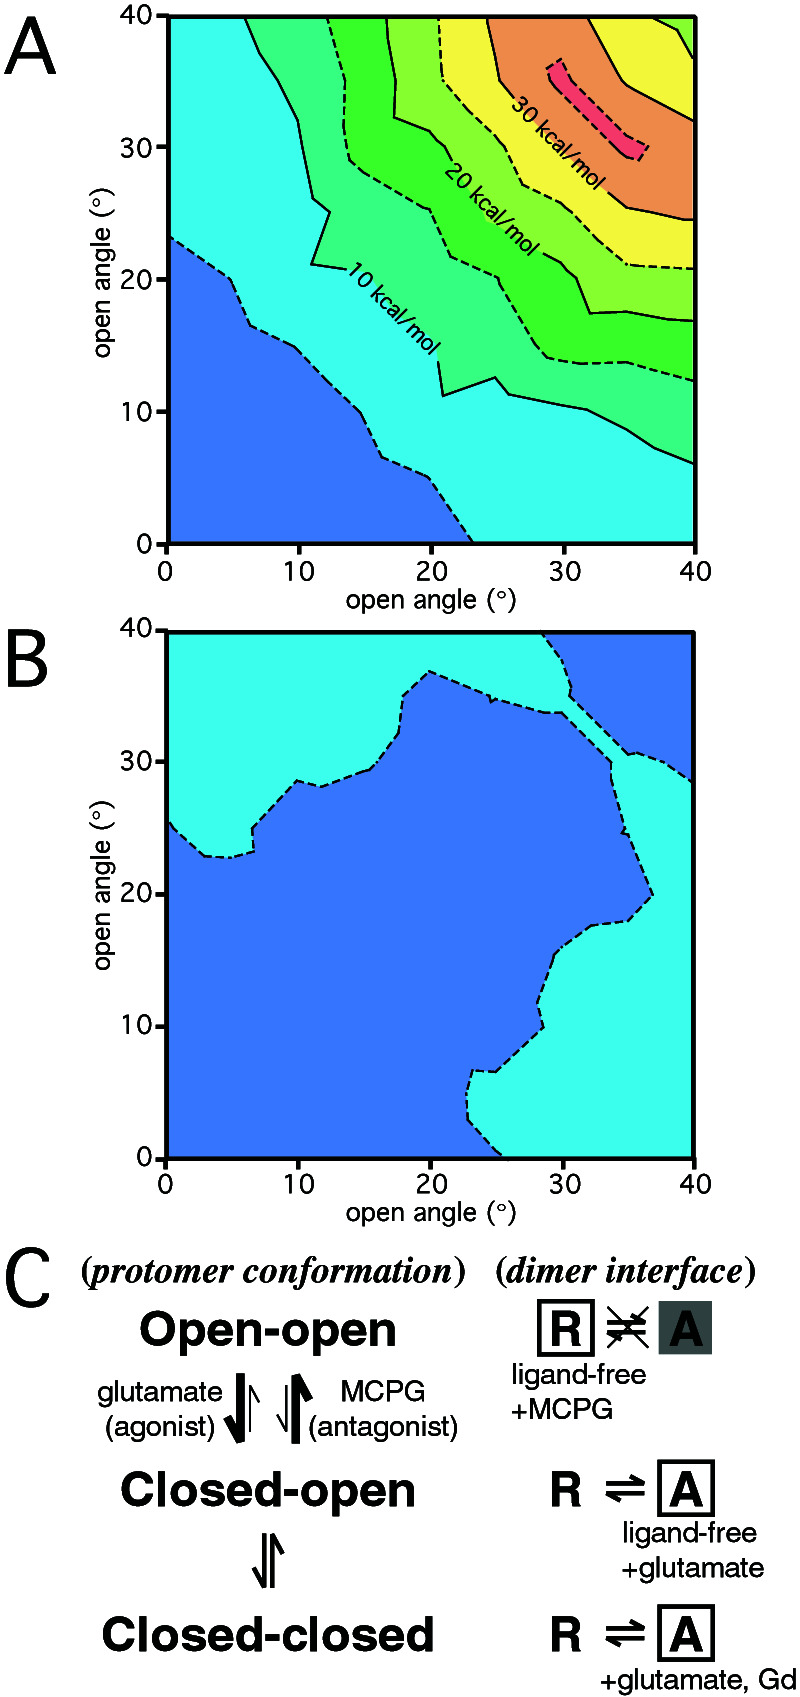
Crystal structures of the extracellular ligand-binding region of the metabotropic glutamate receptor, complexed with an antagonist, (S)-(alpha)-methyl-4-carboxyphenylglycine, and with both glutamate and Gd3+ ion, have been determined by x-ray crystallographic analyses. The structure of the complex with the antagonist is similar to that of the unliganded resting dimer. The antagonist wedges the protomer to maintain an inactive open form. The glutamate/Gd3+ complex is an exact 2-fold symmetric dimer, where each bi-lobed protomer adopts the closed conformation. The surface of the C-terminal domain contains an acidic patch, whose negative charges are alleviated by the metal cation to stabilize the active dimeric structure. The structural comparison between the active and resting dimers suggests that glutamate binding tends to induce domain closing and a small shift of a helix in the dimer interface. Furthermore, an interprotomer contact including the acidic patch inhibited dimer formation by the two open protomers in the active state. These findings provide a structural basis to describe the link between ligand binding and the dimer interface.


Figures

Figure 1
Figure 1
(A) Dose–response curves of S-MCPG (filled diamonds) and R-MCPG (filled squares) in inhibiting [3H]quisqualate binding to m1-LBR. Each reaction contained 0.75 μg of purified m1-LBR. The binding assay was done as described (12, 20). (B) Stereo-pair diagram of m1-LBR complexed with S-MCPG, viewed from the perpendicular direction to the dimer interface. The LB1 and LB2 domains are colored blue and red, respectively, except for the B (cyan), C (green), and F (yellow) helices. The two protomers in the dimeric m1-LBR are distinguished by saturated and light colors. The magenta Corey–Pauling–Koltun model represents the bound S-MCPG. These protomers are related by an NCS 2-fold axis (black arrow). (C) Schematic diagrams of the recognition of S-MCPG (Left) and glutamate, observed in both the closed (Center) and open (Right) protomers of the closed-open/A dimer (4). Yellow and green boxes represent residues forming direct and water-mediated interactions, respectively, with the corresponding ligand. The bound water molecule is depicted by the circled “W.” The recognition of each ligand is established by polar interactions (broken lines) and van der Waals interactions (with W110). (D) Structures of the glutamate-bound form [closed–open/A (4); red for closed, blue for open] superimposed onto the S-MCPG complex (green) by their LB1 domains. The side chain of Y236 blocks the S-MCPG complex from closing. This figure was generated as if the front protomer (saturated color) in B were viewed from the left.
Figure 2
Figure 2
Two orthogonal views of the six open protomers superimposed on the closed protomer (complexed with glutamate; black) by using the LB1 domains [blue, glutamate-bound form (closed-open/A); magenta, ligand-free form (closed–open/A); red and orange, ligand-free form (open-open/R); yellow and green, S-MCPG complex (open–open/R)]. Although the LB1 domains are well superimposed (rmsd 0.44–0.67 Å), the deviations including the LB2 domain increase to 2.9–4.3 Å. However, the application of a simple rotation around the cyan bar significantly reduced the deviation to ≤1.0 Å (Table 2).
Figure 3
Figure 3
(A) Structure of m1-LBR complexed with glutamate and Gd3+ ion, viewed from perpendicular (Left) and parallel (Right) directions to the dimer interface, with the anomalous difference Fourier map (green cages; contoured at 5σ). The coloring is the same as in Fig. 1B. The yellow Corey–Pauling–Koltun model represents the bound glutamate. As the asymmetric unit contains one protomer, its symmetry mate, related by a crystallographic 2-fold axis (black arrows), is drawn by light colors to represent the dimer structure. (B) grasp (28) electrostatic surface representation (negative, red; neutral, white; positive, blue) of the two dimer interfaces, encircled by broken lines.
Figure 4
Figure 4
Local structures of the LB2 interface of the complexes with glutamate and a Gd3+ ion in the closed–closed/A conformer (A), and with the glutamate in the closed–open/A (B). The interface of the hypothetical open–open/A model, of which both open angles are 30°, is shown in C. Yellow and green represent the closed and open protomers, respectively. The 2-fold axis of the dimer is directed perpendicularly to the paper through the center of each figure. The silver sphere in A denotes the site 1 Gd3+ ion.
Figure 5
Figure 5
Structures around the C helix at the LB1 interface. The C and F helices of the S-MCPG-bound open protomer (green) and of the glutamate-bound closed protomer (yellow) are drawn with the corresponding ligands (stick models). The blue and red ends of the helices indicate their N and C termini, respectively. The gray surface represents the open protomer forming the dimeric structure of the glutamate-bound closed–open/A. The LB1 interface is approximately parallel to A, and its orthogonal view is on B. Note that the small upward shift of the C helix is presumably caused by dipole–dipole repulsion between the C and F helices, of which the N termini approach each other on domain closing.
Figure 6
Figure 6
Computed potential energy for the interprotomer nonbonded interactions. Relative electrostatic (A) and van der Waals (B) energies were plotted as a function of the open angles for the two protomers (horizontal and vertical axes). The potential energy difference is contoured at every 5 kcal/mol. The conformations with open angles (5°, 5° and 0°, 0°) exhibit the lowest energies for the electrostatic and van der Waals interactions, respectively. (C) An equilibrium model proposed for m1-LBR. The open boxes indicate the states for which structures have been determined by x-ray crystallographic analyses. The shaded A conformer in the open–open combination forms an energetically unfavorable structure, because of the electrostatic barrier of the LB2 interface.

References

    1. Masu M, Tanabe Y, Tsuchida K, Shigemoto R, Nakanishi S. Nature (London) 1991;349:760–765. - PubMed
    1. Nakanishi S, Masu M. Annu Rev Biophys Biomol Struct. 1994;23:319–348. - PubMed
    1. Hollmann M, Heinemann S. Annu Rev Neurosci. 1994;17:31–108. - PubMed
    1. Kunishima N, Shimada Y, Tsuji Y, Sato T, Yamamoto M, Kumasaka T, Nakanishi S, Jingami H, Morikawa K. Nature (London) 2000;407:971–977. - PubMed
    1. Jane D E, Jones P L, Pook P C-K, Salt T E, Sunter D C, Watkins J C. Neurophamacology. 1993;32:725–727. - PubMed