. 2002 Feb 12;86(4):596-604.
doi: 10.1038/sj.bjc.6600111.

Analyses of apoptotic regulators CASP9 and DFFA at 1P36.2, reveal rare allele variants in human neuroblastoma tumours

Affiliations
Free PMC article

Analyses of apoptotic regulators CASP9 and DFFA at 1P36.2, reveal rare allele variants in human neuroblastoma tumours

F Abel et al. Br J Cancer. .
Free PMC article

Abstract

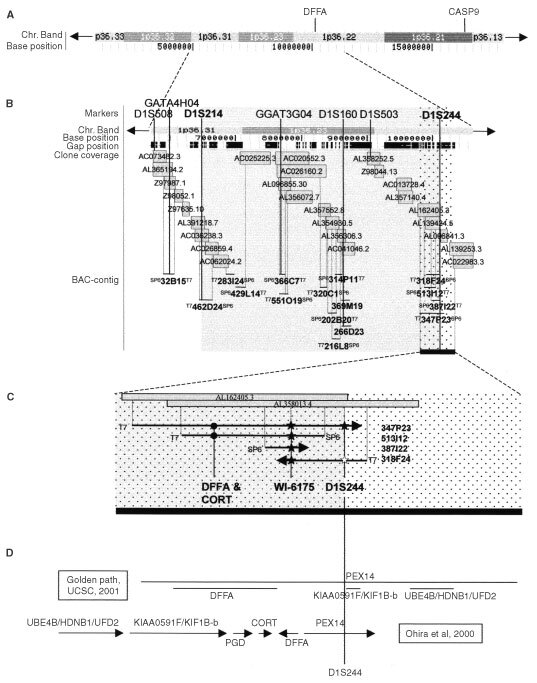
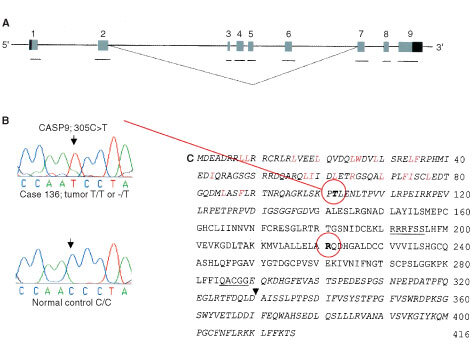
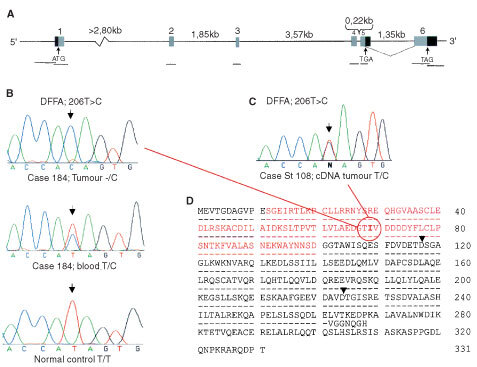
The genes encoding Caspase-9 and DFF45 have both recently been mapped to chromosome region 1p36.2, that is a region alleged to involve one or several tumour suppressor genes in neuroblastoma tumours. This study presents an update contig of the 'Smallest Region of Overlap of deletions' in Scandinavian neuroblastoma tumours and suggests that DFF45 is localized in the region. The genomic organization of the human DFF45 gene, deduced by in-silico comparisons of DNA sequences, is described for the first time in this paper. In the present study 44 primary tumours were screened for mutation by analysis of the genomic sequences of the genes. In two out of the 44 tumours this detected in the DFFA gene one rare allele variant that caused a non-polar to a polar amino acid exchange in a preserved hydrophobic patch of DFF45. One case was hemizygous due to deletion of the more common allele of this polymorphism. Out of 194 normal control alleles only one was found to carry this variant allele, so in respect of it, no healthy control individual out of 97 was homozygous. Moreover, our RT-PCR expression studies showed that DFF45 is preferably expressed in low-stage neuroblastoma tumours and to a lesser degree in high-stage neuroblastomas. We conclude that although coding mutations of Caspase-9 and DFF45 are infrequent in neuroblastoma tumours, our discovery of a rare allele in two neuroblastoma cases should be taken to warrant further studies of the role of DFF45 in neuroblastoma genetics.


Figures

Figure 1
Figure 1
Schematic representation of the localization of CASP9 and DFFA based on alignment-search (‘BLAT-research’) data from ‘Golden path’ at UCSC (http://genome.ucsc.edu). (A) Chromosome band 1p36.13-33 corresponding to approximately 15 Mb, with base position according to UCSC. CASP9 is localized to 1p36.21, and DFFA is localized to 1p36.22. (B) Clone coverage at chromosome band 1p36.22-31 corresponding to approximately 5 Mb. Gap positions in the UCSC-contig are shown at the top. Grey boxes represent clones from ‘Golden path’. Black horizontal bars represent BAC-clones found by our group by PCR-based screening of a BAC-library (Research Genetics). BACs are located according to alignment of BAC-ends to UCSC-clones (dotted vertical lines), and their content of polymorphic markers (black vertical lines). The shaded area represents the SRO of deletions defined earlier by our group (Ejeskar et al, 2001). The dotted area and the thick black bar in the right corner represent the homozygously deleted region found by Ohira et al (2000) that partially overlaps the shaded SRO-region. (C) Enlarged view of the homozygously deleted region found by Ohira et al (2000). Grey boxes represent two clones from ‘Golden path’ (UCSC). BACs are ordered according to alignment of BAC-ends and markers to UCSC-clones (dotted vertical lines). T7 and SP6 display the two BAC-ends sequenced with the T7- and SP6-universal primers. Arrowheads represent BAC-ends ending up in UCSC gap positions, or BAC-ends with no available sequence for alignment-search (see text for details). Markers D1S244, and WI-6175 (*) and the genes DFFA and CORT (•) are mapped to the BACs by PCR assay (black vertical lines). Filled and white figures represent positive and negative PCR-results, respectively. (D) Schematic representation of the order of known genes believed to reside in the region by marker D1S244, proposed by ‘Golden path’ at UCSC (http://genome.ucsc.edu) and Ohira et al (2000).
Figure 2
Figure 2
Schematic representation of the CASP9 gene. (A) Exon-intron organization of the gene corresponding to approximately 5 kb from (Hadano et al, 1999). Exons are numbered from 1–9 in the 5′-3′ direction. Light shaded boxes represent the coding regions of each exon. Dark shaded boxes represent the 5′- and 3′-untranslated flanking regions (UTR's). The black bars represent the nine amplified fragments. The dotted line represents the alternatively spliced CASP9S. (B) Rare polymorphism detected in CASP9. The 305C>T polymorphism located in CASP9 exon 2. Upper panel: Amplified tumour-DNA from case 136, homozygous T/T or hemizygous -/T. Lower panel: Amplified normal-DNA from control Q309, homozygous C/C. (C) The amino acid sequence of caspase-9 and caspase-9S (GenBank accession numbers: NM_001229 and AF110376 respectively). The caspase-9S sequence is represented in italics. The consensus Akt phosphorylation motif RRRFSS (Cardone et al, 1998) and the conserved active site pentapeptide QACGG are underlined. The arrow denotes the aspartic acid (D) residue after which the cleavage occurs during caspase-9 activation (Srinivasula et al, 1996). Letters coloured red represent the conserved hydrophobic residues of the 1CARD97 domain (Hofmann et al, 1997; Zhou et al, 1999). The bold and circled residues indicate the polymorphic sites where amino acid substitution takes place. Threonine (T) is exchanged for isoleucine (I), caused by the 305C>T base pair substitution. Arginine (R) is exchanged for glutamine (Q), caused by the 662A>G base-pair substitution.
Figure 3
Figure 3
Schematic representation of the DFFA gene. (A) Exon-intron organization of the gene corresponding to approximately 11 kb. Exons are numbered from 1–6 in the 5′-3′ direction. Light shaded boxes represent the coding regions of each exon. Dark shaded boxes represent the 5′- and 3′-untranslated flanking regions (UTR's). The 5′ UTR is 56 bp and the most 3′ UTR is 581 bp long. The 3′ UTR of the alternatively spliced fragment after exon 5 is of unknown size. The start and stop codons are indicated by arrows. The black bars represent the eight amplified fragments (promoter-region, exon 1, 2, 3, 4, 5, 6 : 1 and 6 : 2). The dotted line represents the normal splicing of DFFA, encoding DFF45. (B) Rare polymorphism detected in DFFA. The 206T>C polymorphism located in DFFA exon 2. Upper panel: Amplified tumour-DNA from case 184, hemizygous -/C. Middle panel: Amplified constitutional DNA from case 184 (extracted from blood), heterozygous T/C. Lower panel: Amplified constitutional DNA from control Q170 (from blood), homozygous T/T. (C) Amplified tumour-cDNA from case St 108, heterozygous T/C. (D) The amino acid sequence of DFF45 (GenBank accession number: NP_004392). The upper sequence represents the DFF45 (331 aa) amino acid sequence, and the lower sequence represents the DFF35 (268 aa) amino acid sequence. The arrows denote the aspartic acid (D) residue after which the caspase-3 cleavage occurs (Liu et al, 1997; Sakahira et al, 1998). Letters coloured red (residues 12–100) represent the conserved N-terminal domain; CIDE (Cell-death Inducing DFF45-like Effecter; Zhou et al, 2001). The bold and circled residue indicates the polymorphic site where the amino acid substitution takes place. Isoleucine (I) is exchanged for threonine (T), caused by the 206T>C base pair substitution.
Figure 4
Figure 4
RT–PCR expression analysis of CASP9 and DFFA from all stages of neuroblastoma. GN, ganglioneuroma; 1, 2B, 3, and 4, stages of neuroblastoma; +, positive control. Upper panel: Tumour extracted cDNA amplified by RT–PCR with CASP9-primers. Middle panel: Tumour extracted cDNA amplified by RT–PCR with DFFA-primers. Lower panel: GAPDH control cDNA amplified by RT–PCR with GAPDH primers (see text). From left to right: GN, case St 151; stage 1, 118, 161; stage 4S, 125, 162; stage 3, 157, 187, St 124, St 131, St 149; stage 4, 32, 114, 126, 168, 169, 111, St 153, 95, 106, 155, 174, St 102, St 129, St 130; positive control, St 64.

Similar articles

Cited by

References

    1. AbelFEjeskarKKognerPMartinssonT1999Gain of chromosome arm 17q is associated with unfavourable prognosis in neuroblastoma, but does not involve mutations in the somatostatin receptor 2 (SSTR2) gene at 17q24 Br J Cancer 8114021409 - PMC - PubMed
    1. BownNCotterillSLastowskaMO'NeillSPearsonADPlantazDMeddebMDanglotGBrinkschmidtCChristiansenHLauerysGSpelemanF1999Gain of chromosome arm 17q and adverse outcome in patients with neuroblastoma N Engl J Med 34019541961 - PubMed
    1. BrodeurGM1990Neuroblastoma: clinical significance of genetic abnormalities Cancer Surv 9673688 - PubMed
    1. BrodeurGMPritchardJBertholdFCarlsenNLTCastelVCastleberryRPDe BernardiBEvansAEFavrotMHedborgFKanekoMKemsheadJLampertFLeeREJLookATPearsonADJPhilipTRoaldBSawadaTSeegerRCTsuchidaYVoutePA1993Revisions of the international criteria for neuroblastoma diagnosis, staging, and response to treatment (see comments) J Clin Oncol 1114661477 - PubMed
    1. CardoneMHRoyNStennickeHRSalvesenGSFrankeTFStanbridgeEFrischSReedJC1998Regulation of cell death protease caspase-9 by phosphorylation (see comments) Science 28213181321 - PubMed

Publication types

MeSH terms

LinkOut - more resources