

Simultaneous measurements of cerebral oxygenation changes during brain activation by near-infrared spectroscopy and functional magnetic resonance imaging in healthy young and elderly subjects
- PMID: 11870923
- PMCID: PMC6871837
- DOI: 10.1002/hbm.10026
Simultaneous measurements of cerebral oxygenation changes during brain activation by near-infrared spectroscopy and functional magnetic resonance imaging in healthy young and elderly subjects
Abstract
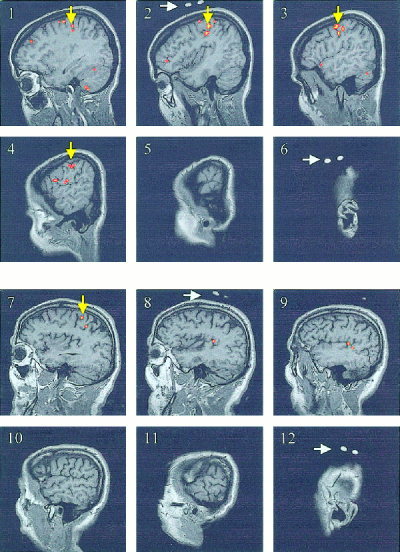
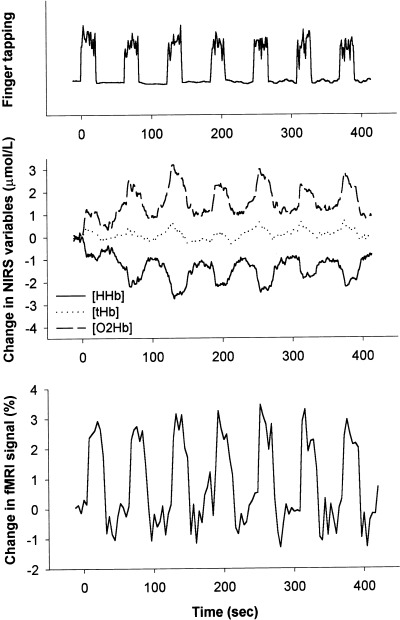
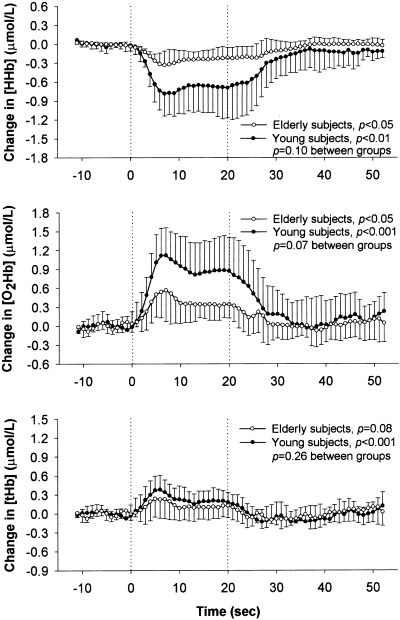
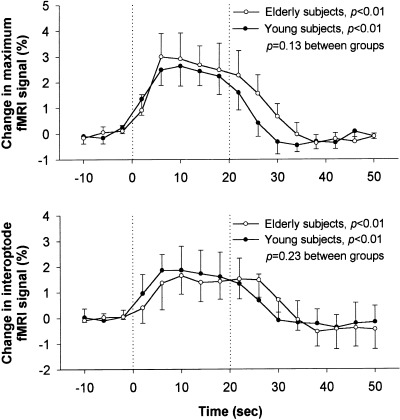
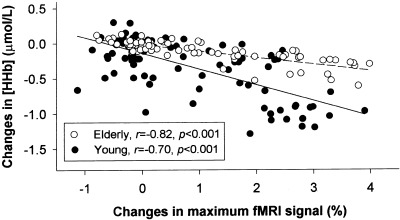
Near infrared spectroscopy (NIRS) and functional magnetic resonance imaging (fMRI) both allow non-invasive monitoring of cerebral cortical oxygenation responses to various stimuli. To compare these methods in elderly subjects and to determine the effect of age on cortical oxygenation responses, we determined motor-task-related changes in deoxyhemoglobin concentration ([HHb]) over the left motor cortex in six healthy young subjects (age 35 +/- 9 years, mean +/- SD) and five healthy elderly subjects (age 73 +/- 3 years) by NIRS and blood-oxygen-level-dependent (BOLD) fMRI simultaneously. The motor-task consisted of seven cycles of 20-sec periods of contralateral finger-tapping at a rate as fast as possible alternated with 40-sec periods of rest. Time-locked averages over the seven cycles were used for further analysis. Task-related decreases in [HHb] over the motor cortex were measured by NIRS, with maximum changes of -0.83 +/- 0.38 mumol/L (P < 0.01) for the young and -0.32 +/- 0.17 mumol/L (P < 0.05) for the elderly subjects. The BOLD-fMRI signal increased over the cortex volume under investigation with NIRS, with maximum changes of 2.11 +/- 0.72% (P < 0.01) for the young and 1.75 +/- 0.71% (P < 0.01) for the elderly subjects. NIRS and BOLD-fMRI measurements showed good correlation in the young (r = -0.70, r(2) = 0.48, P < 0.001) and elderly subjects (r = -0.82, r(2) = 0.67, P < 0.001). Additionally, NIRS measurements demonstrated age-dependent decreases in task-related cerebral oxygenation responses (P < 0.05), whereas fMRI measurements demonstrated smaller areas of cortical activation in the elderly subjects (P < 0.05). These findings demonstrate that NIRS and fMRI similarly assess cortical oxygenation changes in young subjects and also in elderly subjects. In addition, cortical oxygenation responses to brain activation alter with aging.
Copyright 2002 Wiley-Liss, Inc.
Figures
Similar articles
-
A temporal comparison of BOLD, ASL, and NIRS hemodynamic responses to motor stimuli in adult humans.Neuroimage. 2006 Jan 15;29(2):368-82. doi: 10.1016/j.neuroimage.2005.08.065. Epub 2005 Nov 21. Neuroimage. 2006. PMID: 16303317 Free PMC article. Clinical Trial.
-
Quantification of delayed oxygenation in ipsilateral primary motor cortex compared with contralateral side during a unimanual dominant-hand motor task using near-infrared spectroscopy.Brain Res. 2008 May 19;1210:142-7. doi: 10.1016/j.brainres.2008.03.009. Epub 2008 Mar 19. Brain Res. 2008. PMID: 18423579
-
Effective Connectivity of Cortical Sensorimotor Networks During Finger Movement Tasks: A Simultaneous fNIRS, fMRI, EEG Study.Brain Topogr. 2016 Sep;29(5):645-60. doi: 10.1007/s10548-016-0507-1. Epub 2016 Jul 20. Brain Topogr. 2016. PMID: 27438589
-
Comparison of blood-oxygen-level-dependent functional magnetic resonance imaging and near-infrared spectroscopy recording during functional brain activation in patients with stroke and brain tumors.J Biomed Opt. 2007 Nov-Dec;12(6):062110. doi: 10.1117/1.2823036. J Biomed Opt. 2007. PMID: 18163813 Review.
-
Noninvasive cerebral perfusion imaging in high-risk neonates.Semin Perinatol. 2010 Feb;34(1):46-56. doi: 10.1053/j.semperi.2009.10.005. Semin Perinatol. 2010. PMID: 20109972 Free PMC article. Review.
Cited by
-
Statistical analysis of high density diffuse optical tomography.Neuroimage. 2014 Jan 15;85 Pt 1(0 1):104-16. doi: 10.1016/j.neuroimage.2013.05.105. Epub 2013 Jun 2. Neuroimage. 2014. PMID: 23732886 Free PMC article.
-
Neurophysiology tools to lower the stroke onset to treatment time during the golden hour: microwaves, bioelectrical impedance and near infrared spectroscopy.Ann Med. 2022 Dec;54(1):2658-2671. doi: 10.1080/07853890.2022.2124448. Ann Med. 2022. PMID: 36154386 Free PMC article. Review.
-
Preclinical Magnetic Resonance Imaging and Spectroscopy Studies of Memory, Aging, and Cognitive Decline.Front Aging Neurosci. 2016 Jun 29;8:158. doi: 10.3389/fnagi.2016.00158. eCollection 2016. Front Aging Neurosci. 2016. PMID: 27468264 Free PMC article. Review.
-
fMRI-based validation of continuous-wave fNIRS of supplementary motor area activation during motor execution and motor imagery.Sci Rep. 2022 Mar 4;12(1):3570. doi: 10.1038/s41598-022-06519-7. Sci Rep. 2022. PMID: 35246563 Free PMC article.
-
Cerebral tissue pO2 response to stimulation is preserved with age in awake mice.Neurosci Lett. 2019 Apr 23;699:160-166. doi: 10.1016/j.neulet.2019.02.007. Epub 2019 Feb 7. Neurosci Lett. 2019. PMID: 30738870 Free PMC article.
References
-
- American Electroencephalographic Society (1994): Guideline thirteen: guidelines for standard electrode position nomenclature. J Clin Neurophysiol 11: 111–113. - PubMed
-
- Bandettini PA, Jesmanowicz A, Wong EC, Hyde JS (1993): Processing strategies for time‐course data sets in functional MRI of the human brain. Magn Reson Med 30: 161–173. - PubMed
-
- Buckner RL, Snyder AZ, Sanders AL, Raichle ME, Morris JC (2000): Functional brain imaging of young, nondemented, and demented older adults. J Cogn Neurosci 12(Suppl): 24–34. - PubMed
-
- Buxton RB, Frank LR (1997): A model for the coupling between cerebral blood flow and oxygen metabolism during neural stimulation. J Cereb Blood Flow Metab 17: 64–72. - PubMed
-
- Colier WNJM, Quaresima V, Barattelli G, Cavallari P, van der Sluijs M, Ferrari M (1997): Detailed evidence of cerebral hemoglobin oxygenation changes in response to motor cortical activation revealed by a continuous wave spectrophotometer with 10 Hz temporal resolution. Proc SPIE 2979: 390–396.
MeSH terms
LinkOut - more resources
Full Text Sources
Other Literature Sources
Medical
