. 2002 Feb;105(2):196-203.
doi: 10.1046/j.1365-2567.2002.01360.x.

Age-dependent increase of peritoneal B-1b B cells in SCID mice

Affiliations

Age-dependent increase of peritoneal B-1b B cells in SCID mice

Kirk S Hinkley et al. Immunology. 2002 Feb.

Abstract

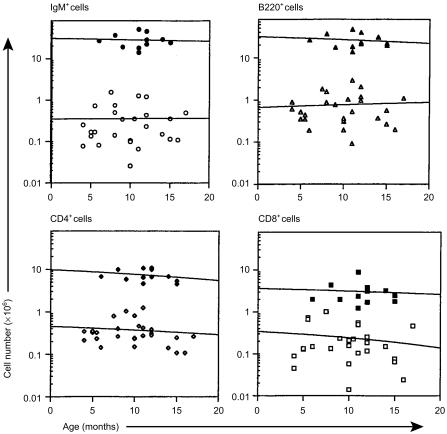
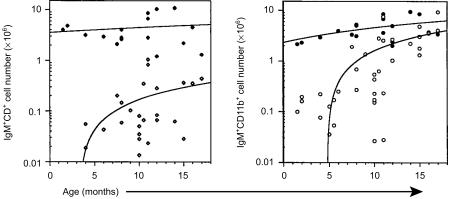
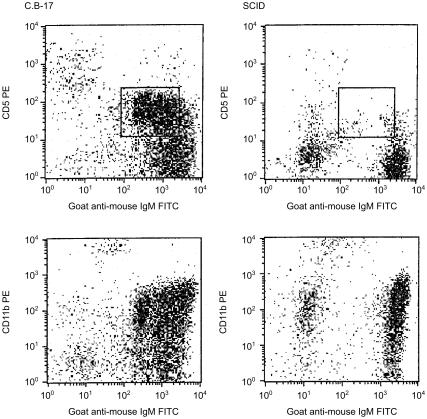
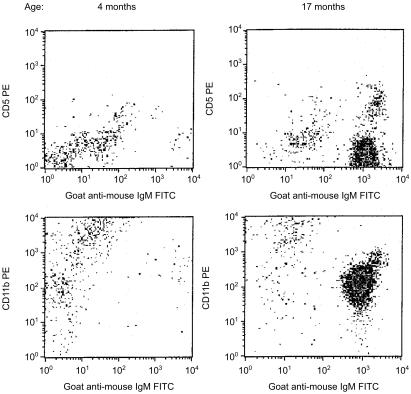
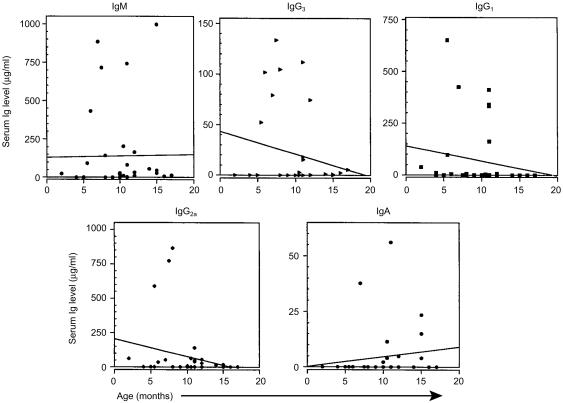
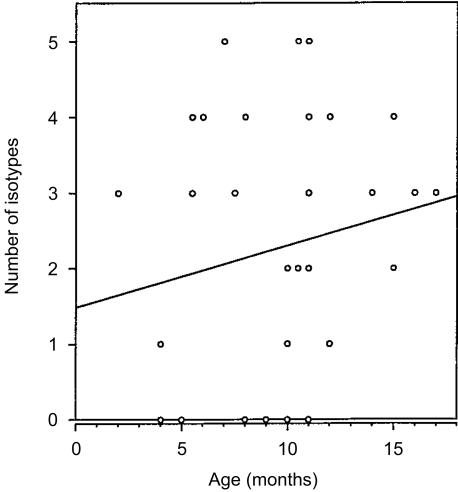
The impact of increasing age upon immunoglobulin production and B-lymphocyte generation in "leaky" severe combined immune-defective (SCID) mice was examined by enzyme-linked immunosorbent assay and flow cytometry. By 1 year of age, the mice had normal numbers of B cells in their peritoneal cavity, while their spleen had very few immunoglobulin M-positive (IgM+) cells. The majority of B cells expressed the CD11b marker characteristic of the B-1b subset. B-1a (CD5+) cells were present at a lower frequency and B-2 cells were absent. The frequency of mice producing detectable immunoglobulin increased with age, and isotype diversity within individual mice was variable. IgM production was most frequently observed followed by IgG3 and IgG2a, then IgG1, and finally IgA. The selective persistence of the B-1 B-cell subset in the peritoneal cavity of aging SCID mice is a natural model for the study of those genetic and environmental influences that determine lymphocyte longevity.


Figures

Figure 1
Figure 1
Flow cytometric analyses of spleen cells from SCID and normal mice. Spleen cells, obtained from SCID (open symbols) and normal (closed symbols) mice at the ages indicated, were subjected to flow cytometric analyses as described in the Materials and Methods. The numbers of cells bearing IgM, B220, CD4 and CD8 were determined by multiplying the viable cell count by the percentage of cells bearing the marker. Horizontal lines represent linear curve-fitting for all the data points.
Figure 2
Figure 2
Flow cytometric analyses of peritoneal cavity cells from SCID and normal mice. Peritoneal cavity cells, obtained from SCID (open symbols) and normal (closed symbols) mice at the ages indicated, were subjected to flow cytometric analyses as described in the Materials and Methods. The numbers of cells co-expressing IgM and CD5 or IgM and CD11b were determined by multiplying the viable cell count by the percentage of cells bearing the marker. The lines represent linear curve fitting for all of the data points.
Figure 3
Figure 3
Flow cytometric analyses of peritoneal cavity cells from age-matched C.B-17 and SCID mice. Peritoneal cavity cells from 11-month-old C.B-17 and SCID mice were stained and analysed as described in the Materials and Methods. The box depicts the location of the B-1a subset.
Figure 4
Figure 4
Flow cytometric analyses of peritoneal cavity cells from young and old SCID mice. Peritoneal cavity cells from 4- and 17-month-old SCID mice were stained and analysed as described in the Materials and Methods.
Figure 5
Figure 5
Serum immunoglobulin production in aging SCID mice. Serum IgM, IgG3, IgG1, IgG2a and IgA levels were determined by ELISA as described in the Materials and Methods. Immunoglobulin levels (µg/ml) found in normal, 8–14-month-old mice were: IgM, 694 ± 61; IgG3, 289 ± 85; IgG1, 262 ± 22; IgG2a, 265 ± 45; IgA, 57 ± 6 [average µg/ml ± SE (n = 8)]. The lines represent linear curve fitting for all the data points. Slope intercept formulae for each isotype were: IgM, y = 0·965x + 129·539; IgG3, y = − 2·32x + 43·265; IgG1, y = − 7·051x + 140·078; IgG2a, y = − 12·472x + 205·580; IgA, y = 0·449x + 0·140. r2 for all curves=0·000.
Figure 6
Figure 6
Variety of serum immunoglobulin isotypes produced in SCID mice. The number of different immunoglobulin isotypes produced in individual SCID mice were plotted versus their age. The line is a linear curve fit for all the data points (y = 0·082x + 1·486; r2 = 0·000).

Similar articles

Cited by

References

    1. Bosma G, Custer R, Bosma M. A severe combined immunodeficiency in the mouse. Nature. 1983;310:527–30. - PubMed
    1. Fulop G, Phillips R. The scid mutation in mice causes a general defect in DNA repair. Nature. 1990;347:479–82. - PubMed
    1. Blunt T, Finnie N, Taccioli G, et al. Defective DNA-dependent protein kinase activity is linked to V (D) J recombination and DNA repair defects associated with murine scid mutation. Cell. 1995;80:813–23. - PubMed
    1. Carroll A, Bosma M. Detection and characterization of functional T cells in mice with severe combined immune deficiency. Eur J Immunol. 1988;18:1965–71. - PubMed
    1. Carroll A, Hardy R, Bosma M. Occurrence of mature B (IgM+,B220+) and T (CD3+) lymphocytes in SCID mice. J Immunol. 1989;143:1087–93. - PubMed

Publication types