. 2002 Mar;68(3):1025-32.
doi: 10.1128/AEM.68.3.1025-1032.2002.

Chlorine disinfection of atypical mycobacteria isolated from a water distribution system

Affiliations

Chlorine disinfection of atypical mycobacteria isolated from a water distribution system

Corinne Le Dantec et al. Appl Environ Microbiol. 2002 Mar.

Abstract

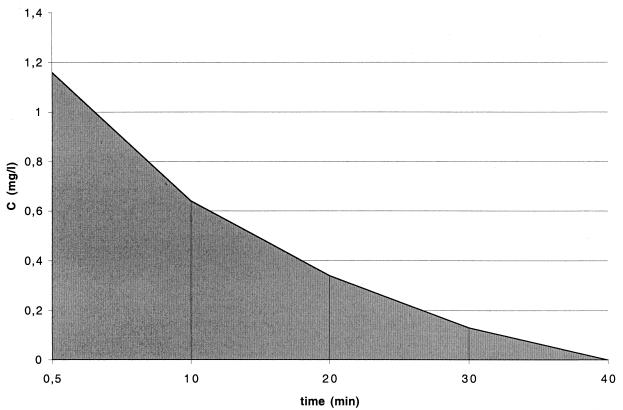
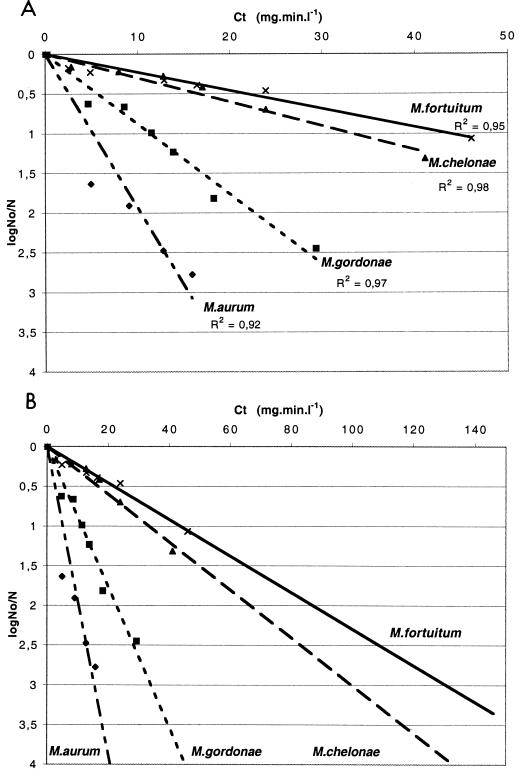
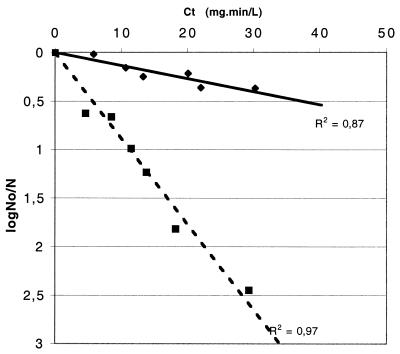
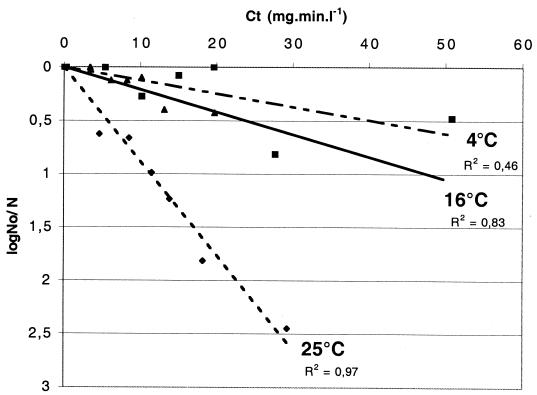
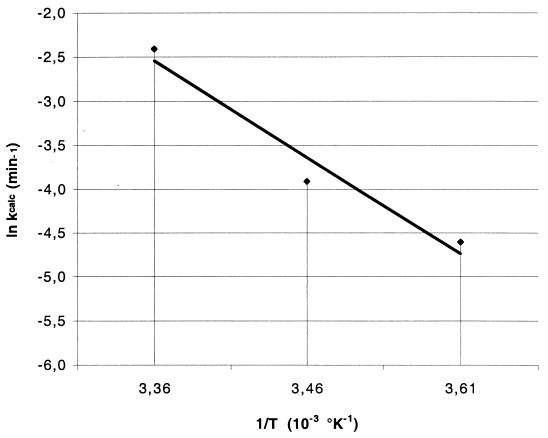
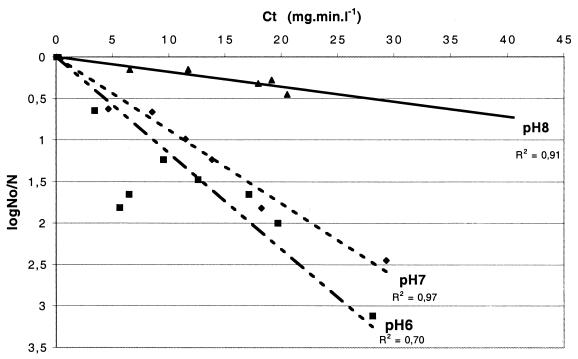
We studied the resistance of various mycobacteria isolated from a water distribution system to chlorine. Chlorine disinfection efficiency is expressed as the coefficient of lethality (liters per minute per milligram) as follows: Mycobacterium fortuitum (0.02) > M. chelonae (0.03) > M. gordonae (0.09) > M. aurum (0.19). For a C.t value (product of the disinfectant concentration and contact time) of 60 mg.min.liter(-1), frequently used in water treatment lines, chlorine disinfection inactivates over 4 log units of M. gordonae and 1.5 log units of M. fortuitum or M. chelonae. C.t values determined under similar conditions show that even the most susceptible species, M. aurum and M. gordonae, are 100 and 330 times more resistant to chlorine than Escherichia coli. We also investigated the effects of different parameters (medium, pH, and temperature) on chlorine disinfection in a chlorine-resistant M. gordonae model. Our experimental results follow the Arrhenius equation, allowing the inactivation rate to be predicted at different temperatures. Our results show that M. gordonae is more resistant to chlorine in low-nutrient media, such as those encountered in water, and that an increase in temperature (from 4 degrees C to 25 degrees C) and a decrease in pH result in better inactivation.


Figures

FIG. 1.
FIG. 1.
Schematic representation of the integration calculation of C · t values. The shaded area was used to estimate the integral term equation (equation 1) as described in Materials and Methods. The initial chlorine concentration was 1.16 mg/liter.
FIG. 2.
FIG. 2.
Inactivation of various mycobacterial species with chlorine. (A) The data presented are the averages of a minimum of two replicates. Linear regressions based on the logarithm of the fraction of the original number of mycobacteria remaining at time t (in minutes) for each strain were calculated as shown in Fig. 1 and used to calculate C · t values. For each species tested, the experimental conditions were pH 7, a temperature of 25°C, and an initial chlorine concentration of 0.5 mg/liter. Cells were grown in Middlebrook 7H9-Tween medium. No, initial number of CFU; N, number of CFU at the time of the assays. (B) Extrapolation of experimental curves to determine C · t values for 3 log units of cell death. Slopes were calculated as follows: M. aurum, y = 0.19 x; M. gordonae, y = 0.09 x; M. chelonae, y = 0.03 x; and M. fortuitum, y = 0.04 x. R2, correlation coefficient values.
FIG. 3.
FIG. 3.
Effects of culture medium on the susceptibility of M. gordonae to free chlorine. C · t values were calculated as described in the legend to Fig. 1. Experimental conditions were pH 7, a temperature of 25°C, and an initial chlorine concentration of 0.5 mg/liter. No, initial number of CFU; N, number of CFU at the time of the assays. Symbols: ⧫, water plus 10% Middlebrook 7H9-Tween medium (y = 0.01 x); ▪, 100% Middlebrook 7H9-Tween medium (y = 0.09 x). R2, correlation coefficient values.
FIG. 4.
FIG. 4.
Effects of temperature on chlorine inactivation of M. gordonae. Experimental conditions were pH 7 and an initial chlorine concentration of 0.5 mg/liter. Cells were grown in Middlebrook 7H9-Tween medium. The chlorine susceptibility of M. gordonae was analyzed at 4, 16, and 25°C. No, initial number of CFU; N, number of CFU at each time point. Symbols: ▪, 4°C (y = 0.01 x); ▴, 16°C (y = 0.02 x); ⧫, 25°C (y = 0.09 x). R2, correlation coefficient values.
FIG. 5.
FIG. 5.
Arrhenius plot of k values versus temperature. The abscissa values correspond to the temperatures tested in Fig. 4; 3.36 corresponds to 25°C, 3.46 corresponds to 16°C, and 3.61 corresponds to 4°C. Linear regression of the data yielded an activation energy of 9.14 J/mol and a log frequency factor of 1.10 as defined by the Arrhenius equation (equation 2).
FIG. 6.
FIG. 6.
Effects of pH on the rate of inactivation of M. gordonae. Experimental conditions were a temperature of 25°C and an initial chlorine concentration of 0.5 mg/liter. Cells were grown in Middlebrook 7H9-Tween medium. No, initial number of CFU; N, number of CFU at each time point. Experiments were conducted with different phosphate (0.05 M) buffers within the pH range of 6.0 to 8.0. Slopes were calculated as follows: pH 6, y = 0.11 x; pH 7, y = 0.09 x; and pH 8, y = 0.02 x. R2 , correlation coefficient values.

References

    1. Asselineau, C., and J. Asselineau. 1978. Lipides spécifiques des mycobactéries. Ann. Microbiol. 129:46-69.J. D. - PubMed
    1. Asselineau, J., and E. Lederer. 1953. Chimie des lipides bactériens. Prog. Chem. Nat. Org. Subst. 10:170-273.
    1. Astagneau, P., N. Desplaces, V. Vincent, V. Chicheportiche, A. H. Botherel, S. Maugat, K. Lebascle, P. Leonard, J. C. Desenclos, J. Grosset, J. M. Ziza, and G. Brücker. 2001. Mycobacterium xenopi spinal infections after disco-vertebral surgery: investigation and screening of a large outbreak. Lancet 358:747-751. - PubMed
    1. Bolan, G., A. L. Reingold, L. A. Carson, V. A. Silcox, C. L. Woodley, P. S. Hayes, A. W. Hightower, L. McFarland, J. W. d. Brown, and N. J. Petersen. 1985. Infections with Mycobacterium chelonei in patients receiving dialysis and using processed hemodialyzers. J. Infect. Dis. 152:1013-1019. - PubMed
    1. Campagnaro, R. L., H. Teichtahl, and B. Dwyer. 1994. A pseudoepidemic of Mycobacterium chelonae: contamination of a bronchoscope and autocleaner. Aust. N. Z. J. Med. 24:693-695. - PubMed

Publication types

MeSH terms

LinkOut - more resources