

Quantitative trait loci controlling vegetative growth rate in the edible basidiomycete Pleurotus ostreatus
- PMID: 11872457
- PMCID: PMC123780
- DOI: 10.1128/AEM.68.3.1109-1114.2002
Quantitative trait loci controlling vegetative growth rate in the edible basidiomycete Pleurotus ostreatus
Abstract
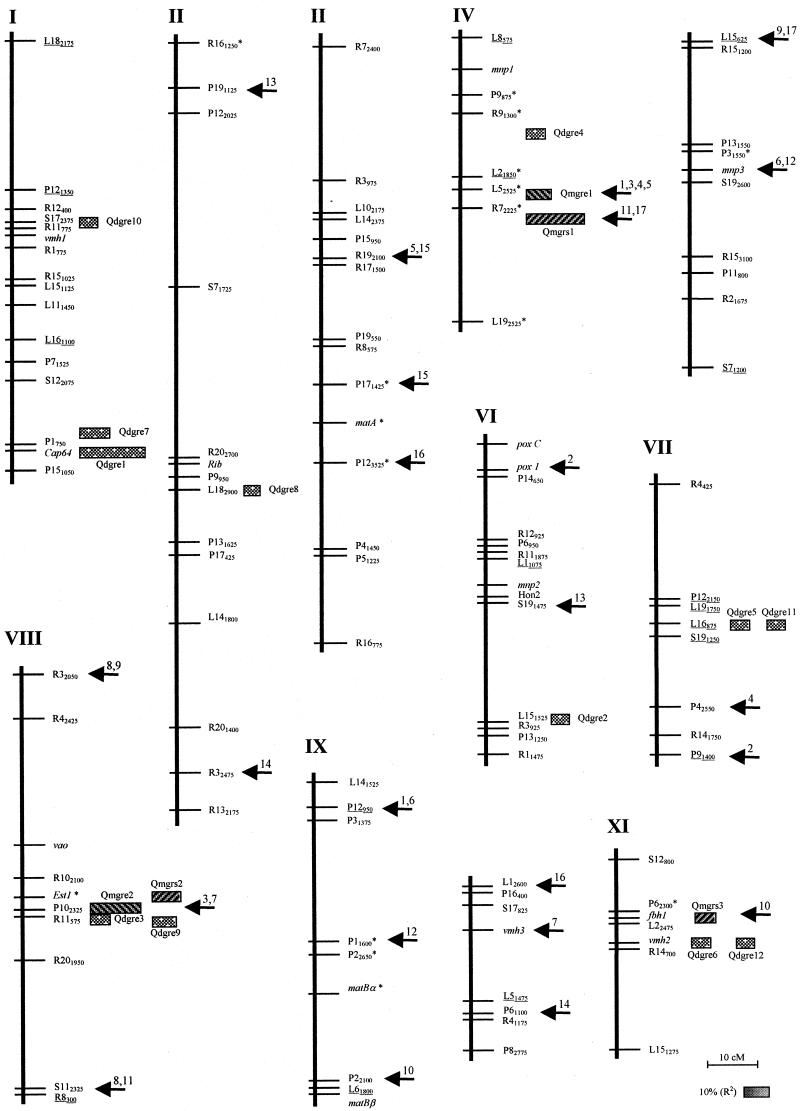
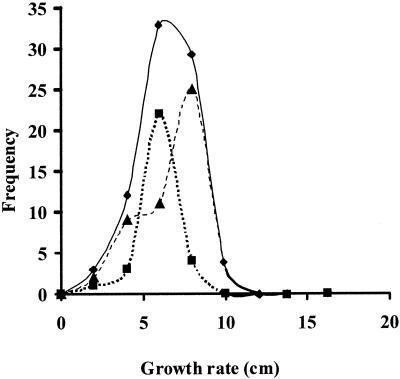
Mycelium growth rate is a quantitative characteristic that exhibits continuous variation. This trait has applied interest, as growth rate is correlated with production yield and increased advantage against competitors. In this work, we studied growth rate variation in the edible basidiomycete Pleurotus ostreatus growing as monokaryotic or dikaryotic mycelium on Eger medium or on wheat straw. Our analysis resulted in identification of several genomic regions (quantitative trait loci [QTLs]) involved in the control of growth rate that can be mapped on the genetic linkage map of this fungus. In some cases monokaryotic and dikaryotic QTLs clustered at the same map position, indicating that there are principal genomic areas responsible for growth rate control. The availability of this linkage map of growth rate QTLs can help in the design of rational strain breeding programs based on genomic information.
Figures
References
-
- Ballero, M., E. Mascia, A. Rescigno, and E. S. D. Teulada. 1990. Use of Pleurotus for transformation of polyphenols in waste waters from olive presses into proteins. Micol. Ital. 19:39-41.
-
- Beyer, D. M., P. J. Wuest, and J. J. Kremser. 2000. Evaluation of epidemiological factors and mushroom substrate characteristics influencing the occurrence and development of Trichoderma green mold, p. 633-640. In L. J. L. D. van Griensven (ed.), Science and cultivation of edible fungi, vol. 2. A. A. Balkema, Rotterdam, The Netherlands.
-
- Bos, I., and P. Caligari. 1995. Selection methods in plant breeding, 1st ed. Chapman & Hall, London, United Kingdom.
-
- Chang, R. 1996. Functional properties of edible mushrooms. Nutr. Rev. 54:91-93. - PubMed
Publication types
MeSH terms
LinkOut - more resources
Full Text Sources
