

Quantitative detection of microbial genes by using DNA microarrays
- PMID: 11872496
- PMCID: PMC123775
- DOI: 10.1128/AEM.68.3.1425-1430.2002
Quantitative detection of microbial genes by using DNA microarrays
Abstract
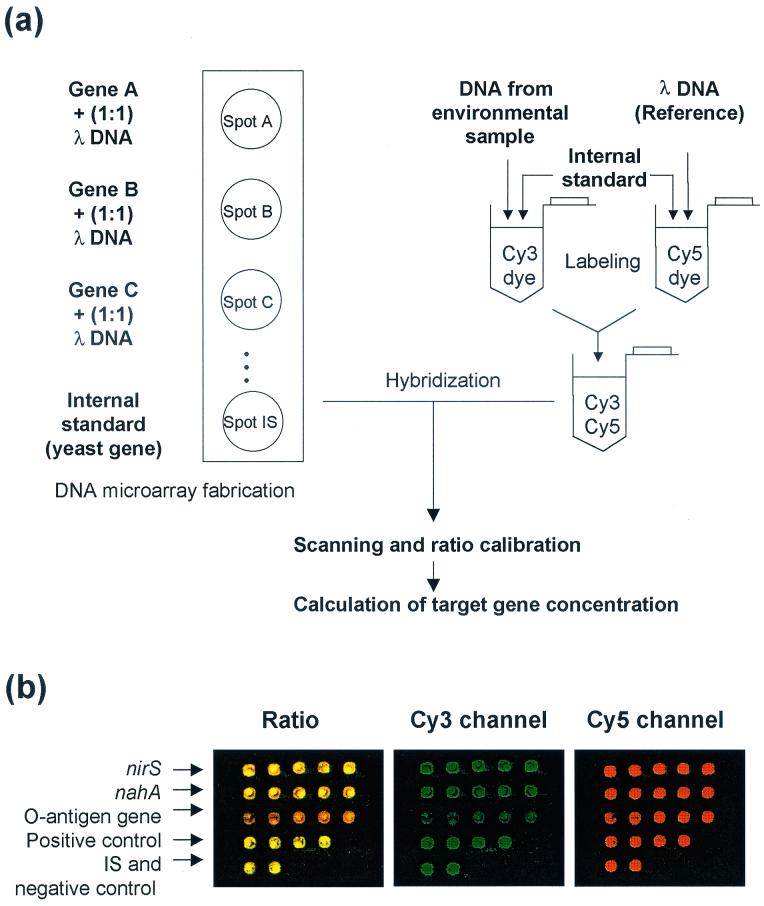
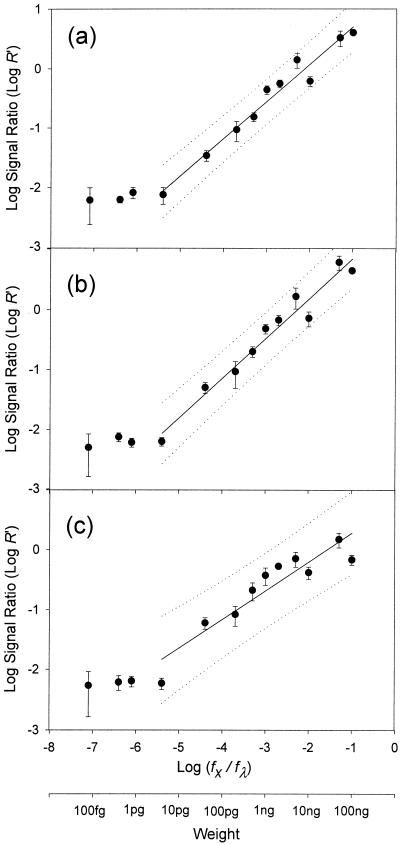
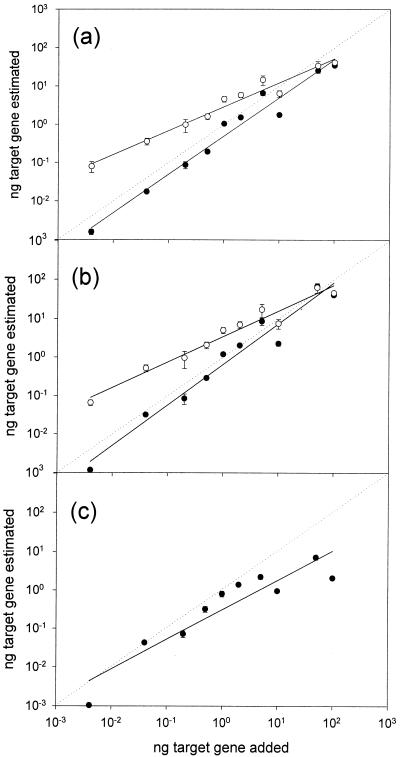
To quantify target genes in biological samples using DNA microarrays, we employed reference DNA to normalize variations in spot size and hybridization. This method was tested using nitrate reductase (nirS), naphthalene dioxygenase (nahA), and Escherichia coli O157 O-antigen biosynthesis genes as model genes and lambda DNA as the reference DNA. We observed a good linearity between the log signal ratio and log DNA concentration ratio at DNA concentrations above the method's detection limit, which was approximately 10 pg. This approach for designing quantitative microarrays and the inferred equation from this study provide a simple and convenient way to estimate the target gene concentration from the hybridization signal ratio.
Figures
References
-
- Albretsen, C., K. H. Kalland, B. I. Haukanes, L. S. Havarstein, and K. Kleppe. 1990. Applications of magnetic beads with covalently attached oligonucleotides in hybridization: isolation and detection of specific measles virus mRNA from a crude cell lysate. Anal. Biochem. 189:40-50. - PubMed
-
- Behr, M. A., M. A. Wilson, W. P. Gill, H. Salamon, G. K. Schoolnik, S. Rane, and P. M. Small. 1999. Comparative genomics of BCG vaccines by whole-genome DNA microarray. Science 284:1520-1523. - PubMed
-
- Britten, R. J., and E. H. Davidson. 1988. Hybridization strategy, p. 3-14. In B. D. Hames and S. J. Higgins (ed.), Nucleic acid hybridization, a practical approach. IRL Press, Oxford, England.
-
- Chakravarti, A. 1999. Population genetics—making sense out of sequence. Nat. Genet. 21:56-60. - PubMed
Publication types
MeSH terms
Substances
LinkOut - more resources
Full Text Sources
Other Literature Sources
Molecular Biology Databases
