Grape seed extract activates Th1 cells in vitro
- PMID: 11874895
- PMCID: PMC119947
- DOI: 10.1128/cdli.9.2.470-476.2002
Grape seed extract activates Th1 cells in vitro
Abstract
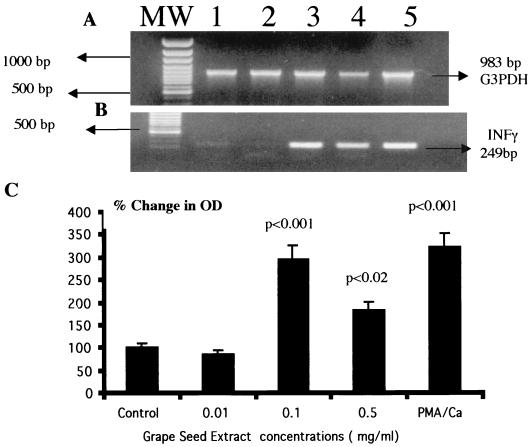
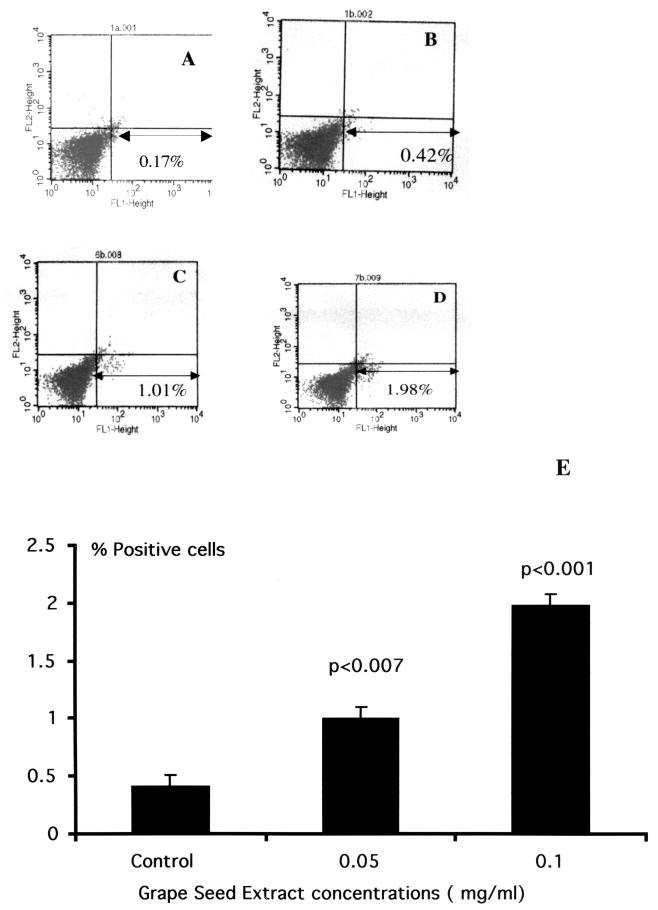
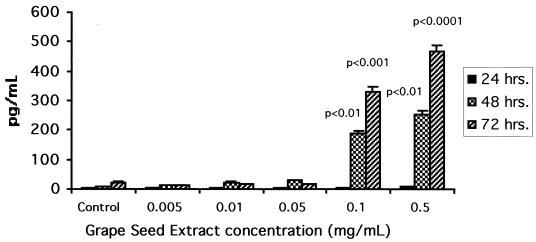
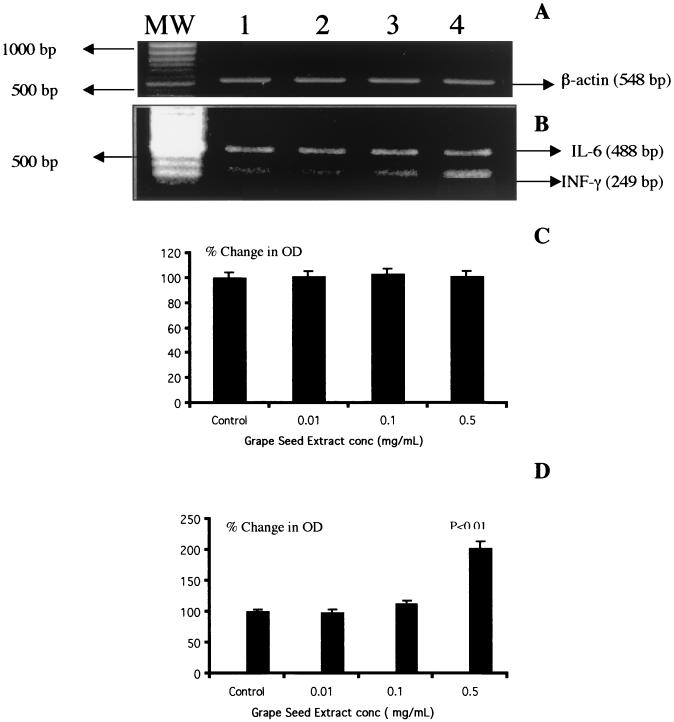
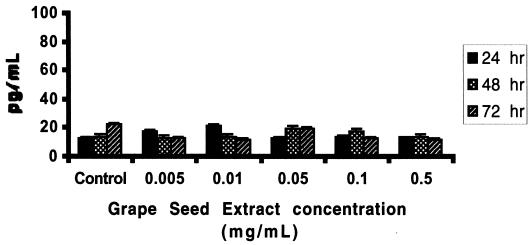
Although flavonoids manifest a diverse range of biological activities, including antitumor and antiviral effects, the molecular mechanisms underlying these activities await elucidation. We hypothesize that the flavonoid constituents of a proprietary grape seed extract (GSE) that contains procyandins exert significant antiviral and antitumor effects, by inducing production of the Th1-derived cytokine gamma interferon (IFN-gamma) by peripheral blood mononuclear cells) from healthy donors. Our results show that GSE significantly induced the transcription of IFN-gamma mRNA as demonstrated by reverse transcription-PCR but had no effect on the Th2-derived cytokine interleukin-6. The enhancing effect of GSE on IFN-gamma expression was further supported by a concomitant increase in the number of cells with intracytoplasmic IFN-gamma as well as the synthesis and secretion of IFN-gamma. Our results demonstrate that the potentially beneficial immunostimulatory effects of GSE may be mediated through the induction of IFN-gamma.
Figures
Similar articles
-
The modulative effect of Cyperi Rhizoma on Th1/Th2 lineage development.Cytokine. 2010 Sep;51(3):259-65. doi: 10.1016/j.cyto.2010.05.011. Epub 2010 Jun 26. Cytokine. 2010. PMID: 20580249
-
The impact of Zataria multiflora Boiss extract on in vitro and in vivo Th1/Th2 cytokine (IFN-γ/IL4) balance.J Ethnopharmacol. 2013 Dec 12;150(3):1024-31. doi: 10.1016/j.jep.2013.10.003. Epub 2013 Oct 22. J Ethnopharmacol. 2013. PMID: 24157376
-
The Effect of Safranal on Th1/Th2 Cytokine Balance.Iran J Immunol. 2016 Dec;13(4):263-273. Iran J Immunol. 2016. PMID: 27999238
-
Effects of oral administration of Phellinus linteus on the production of Th1- and Th2-type cytokines in mice.Immunopharmacol Immunotoxicol. 2006;28(2):281-93. doi: 10.1080/08923970600809363. Immunopharmacol Immunotoxicol. 2006. PMID: 16873096
-
The influence of hydro-ethanolic extract of Portulaca oleracea L. on Th1/Th2 balance in isolated human lymphocytes.J Ethnopharmacol. 2016 Dec 24;194:1112-1121. doi: 10.1016/j.jep.2016.10.082. Epub 2016 Nov 10. J Ethnopharmacol. 2016. PMID: 27842944
Cited by
-
The Signaling Pathways, and Therapeutic Targets of Antiviral Agents: Focusing on the Antiviral Approaches and Clinical Perspectives of Anthocyanins in the Management of Viral Diseases.Front Pharmacol. 2019 Nov 8;10:1207. doi: 10.3389/fphar.2019.01207. eCollection 2019. Front Pharmacol. 2019. PMID: 31787892 Free PMC article. Review.
-
Grape seed extract and L-ascorbic acid exert antineoplastic effects against solid Ehrlich carcinoma in vivo by modulating the tumor microenvironment and Th1/Th2 balance.Front Immunol. 2025 Aug 6;16:1635071. doi: 10.3389/fimmu.2025.1635071. eCollection 2025. Front Immunol. 2025. PMID: 40843004 Free PMC article.
-
Neem leaf preparation enhances Th1 type immune response and anti-tumor immunity against breast tumor associated antigen.Cancer Immun. 2007 Mar 30;7:8. Cancer Immun. 2007. PMID: 17394284 Free PMC article.
-
Examining the interactions of Galahad™ compound with viruses to develop a novel inactivated influenza A virus vaccine.Heliyon. 2022 Jul;8(7):e09887. doi: 10.1016/j.heliyon.2022.e09887. Epub 2022 Jul 6. Heliyon. 2022. PMID: 35821966 Free PMC article.
-
The effect of OPC Factor on energy levels in healthy adults ages 45-65: a phase IIb randomized controlled trial.J Altern Complement Med. 2008 Jul;14(6):723-32. doi: 10.1089/acm.2007.0661. J Altern Complement Med. 2008. PMID: 18684077 Free PMC article. Clinical Trial.
References
-
- Belardelli, F. 1995. Role of interferons and other cytokines in the regulation of the immune responses. APMIS 103:161-176. - PubMed
-
- Chomczynski, P., and N. Sacchi. 1987. Single-step method of RNA isolation by acid guanidinium thiocyanate-phenol-chloroform extraction. Ann. Biochem. 162:156-159. - PubMed
-
- Dickensheets, H. L., and R. P. Donnelly. 1999. Inhibition of IL-4-inducible gene expression in human monocytes by type I and type II interferons. J. Leukoc. Biol. 65:307-312. - PubMed
-
- Kappagoda, C. T., M. Karim, K. McCormick, and C. K. Kandaswami. 2000. Unravelling the French paradox. C. Chem. Innov. 30:26-31.
-
- Lucey, D. R. 1999. Evolution of the type-1 (Th1)-type-2 (Th2) cytokine paradigm. Infect. Dis. Clin. N. Am. 13:1-9. - PubMed
Publication types
MeSH terms
Substances
Grants and funding
LinkOut - more resources
Full Text Sources
Other Literature Sources