Comparative Study
. 2002 Mar;12(3):503-14.
doi: 10.1101/gr.213802.

Gene3D: structural assignment for whole genes and genomes using the CATH domain structure database

Affiliations
Comparative Study

Gene3D: structural assignment for whole genes and genomes using the CATH domain structure database

Daniel W A Buchan et al. Genome Res. 2002 Mar.

Abstract

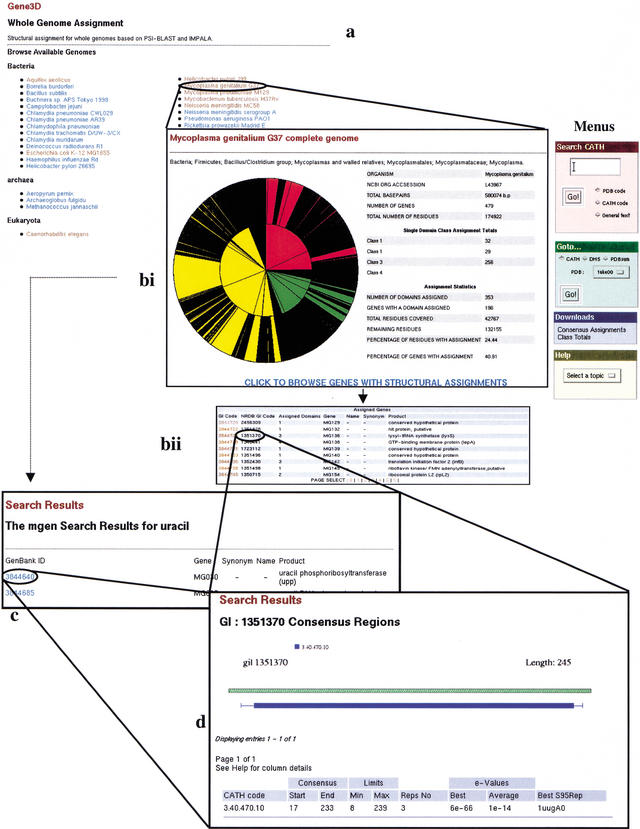
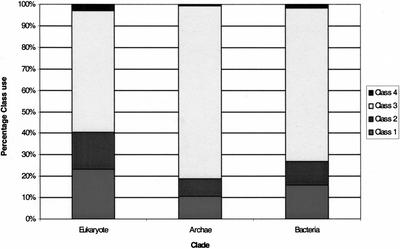
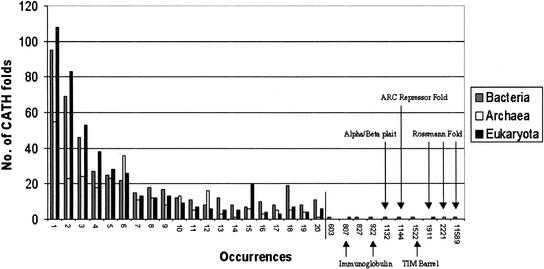
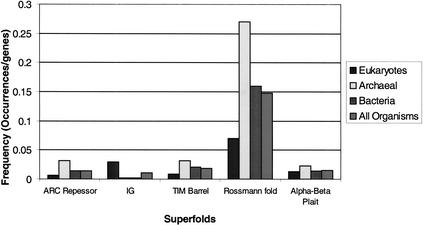
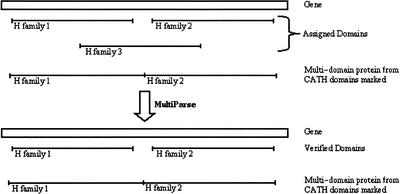
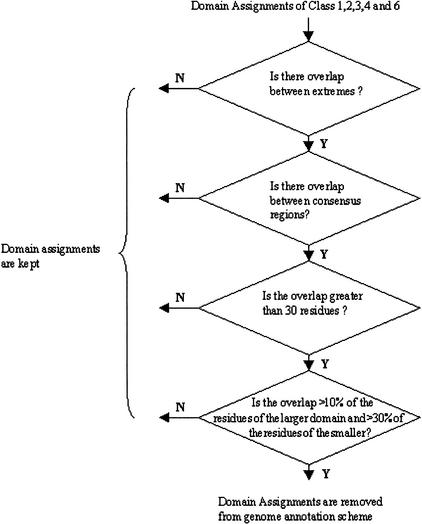
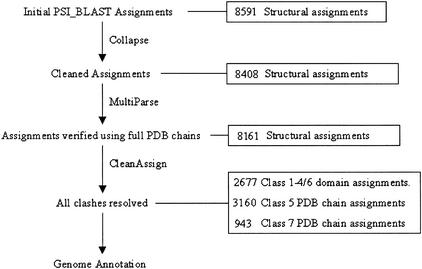
We present a novel web-based resource, Gene3D, of precalculated structural assignments to gene sequences and whole genomes. This resource assigns structural domains from the CATH database to whole genes and links these to their curated functional and structural annotations within the CATH domain structure database, the functional Dictionary of Homologous Superfamilies (DHS) and PDBsum. Currently Gene3D provides annotation for 36 complete genomes (two eukaryotes, six archaea, and 28 bacteria). On average, between 30% and 40% of the genes of a given genome can be structurally annotated. Matches to structural domains are found using the profile-based method (PSI-BLAST). and a novel protocol, DRange, is used to resolve conflicts in matches involving different homologous superfamilies.


Figures

Figure 1
Figure 1
An overview of the Gene3D server. (a) Genome Selection page. From here you can pick a genome to search. This brings up the assignment statistics page. Choosing ‘full’ also includes a summary of all the domains assigned to the genome. ‘Brief’ presents you with just the statistics. (b) Once a genome is selected, you get the statistics page. From here you can choose to search the genome using a keyword search; you can pick a gene from the list presented in the search results page (marked C). If you select a gene, you will go straight to that gene's domain assignments. (c) The Keyword search page. If you chose to search the genome using a key word (in this case, ‘uracil’), you will be presented with every gene in that genome which is associated with this key word. From here you can pick your gene of interest. (d) The assignment results page. If you chose a gene on the statistics page or on the search results page, you will be presented with the assignment results. These are presented as a diagram of the domain assignments (below the green hashed representation of the gene) and a summary of the PSI-BLAST results which led to this assignment (in the table below). From here you can link to the CATH database, the DHS, and PDBsum to gather further functional and structural information.
Figure 2
Figure 2
Chart of relative distribution of CATH fold classes within each clade. Class 1, All-alpha; Class 2, All-beta; Class 3, Alpha/Beta; Class 4, Few secondary structures.
Figure 3
Figure 3
The distribution of fold families and the repetition of their use as defined by the number of occurrences.
Figure 4
Figure 4
The frequency of superfold usage in the three kingdoms expressed as the number of occurrences of the fold divided by the total number of genes in the organisms used in the given kingdom. The results are presented alongside the frequency within all organisms.
Figure 5
Figure 5
Error per query (%) by Coverage (%) obtained for one-to-one relationships. The coverage is measured using the CATH-35 sequences. This graph shows the percent coverage of true positives divided by the total number of possible assignments against the numbers of errors per query. These values are plotted for the differing percentages of the query domain (Q) in the alignment.
Figure 6
Figure 6
Domain Finder. This illustrates the derivation of consensus and extreme regions for domain assignment.
Figure 7
Figure 7
This figure indicates how DomainFinder's cautious assignment of consensus regions can produce consensus regions that the DRange protocol considers to be noise. In this instance, several S95 rep hits have hit a region of a gene (indicated in black). The DomainFinder algorithm has attempted to merge these into a consensus region but one of them is considered by DomainFinder to be too small to belong with the others (it has insufficient overlap with the others), and a second consensus, made from only one Srep hit, is built. For the purposes of the Gene3D resource, it is sufficient that the smaller domain is merged into the larger region.
Figure 8
Figure 8
The Collapse module consensus assignments. Boxes, shown in white, represent consensus regions on the ‘Gene’, and the ‘New assignment’ boxes, in black, represent the possible outcomes of collapsing the initial assignments. The Collapse module seeks to allow cases A and B without allowing case C (Chaining). In case A, the two regions from the same homologous superfamily overlap to a great enough extent that they are merged together. In case B, one region is contained within another region of the same homologous superfamily and they are merged. In case C, it is clear that the top and bottom regions do not overlap, so merging of all four regions is not allowed.
Figure 9
Figure 9
The process of domain resolution using MultiParse. Genes are indicated as boxes and the domains as the tagged lines. The multidomain protein is labeled with the two domains identified within it. Because the multidomain represents a global hit, it is assumed that the gene has similar pattern of domains; as a result, assignments for H families 1 and 2 are kept, whereas the assignment for H family 3 is lost.
Figure 10
Figure 10
The Clean Assign Module's decision flowchart for deciding on acceptable overlaps between consensus regions with differing homologous superfamily assignments. The CATH domain assignments from domains in CATH classes 1, 2, 3, 4, and 6 (see Table 1) are analyzed by the decision tree.
Figure 11
Figure 11
The data resolution process with typical figures taken from the Genome Annotation of Escherichia coli. The final domain assignments are for all CATH classes. Classes 1–4 and 6 are the single domains classified in CATH (see Table 1). Classes 5 and 7 are full protein chains at various stages of classification.

References

    1. Altschul SF, Madden TL, Schaffer AA, Zhang J, Zhang Z, Miller W, Lipman DJ. Gapped BLAST and PSI-BLAST: A new generation of protein database search programs. Nucleic Acids Res. 1997;25:3389–3402. - PMC - PubMed
    1. Apweiler R, Attwood TK, Bairoch A, Bateman A, Birney E, Biswas M, Bucher P, Cerutti L, Corpet F, Croning MDR, et al. The InterPro database, an integrated documentation resource for protein families, domains and functional sites. Nucleic Acids Res. 2001a;29:37–40. - PMC - PubMed
    1. Apweiler R, Biswas M, Fleischmann W, Kanapin A, Karavidopoulou Y, Kersey P, Kriventseva EV, Mittard V, Mulder N, Phan, et al. Proteome Analysis Database: Online application of InterPro and CluSTr for the functional classification of proteins in whole genomes. Nucleic Acids Res. 2001b;29:44–48. - PMC - PubMed
    1. Bairoch A, Apweiler R. The SWISS-PROT protein sequence database and its supplement TrEMBL in 2000. Nucleic Acids Res. 2000;28:45–48. - PMC - PubMed
    1. Bateman A, Birney E, Durbin R, Eddy SR, Howe KL, Sonnhammer EL. The Pfam Protein Families Database. Nucleic Acids Res. 2000;28l:263–266. - PMC - PubMed

Publication types